The network for creativity
Join 1.25M professional creatives like you
Connect with clients, get discovered, and run your business 100% commission-free
Creatives on Contra have earned over $150M and we are just getting started
Back to feedPost

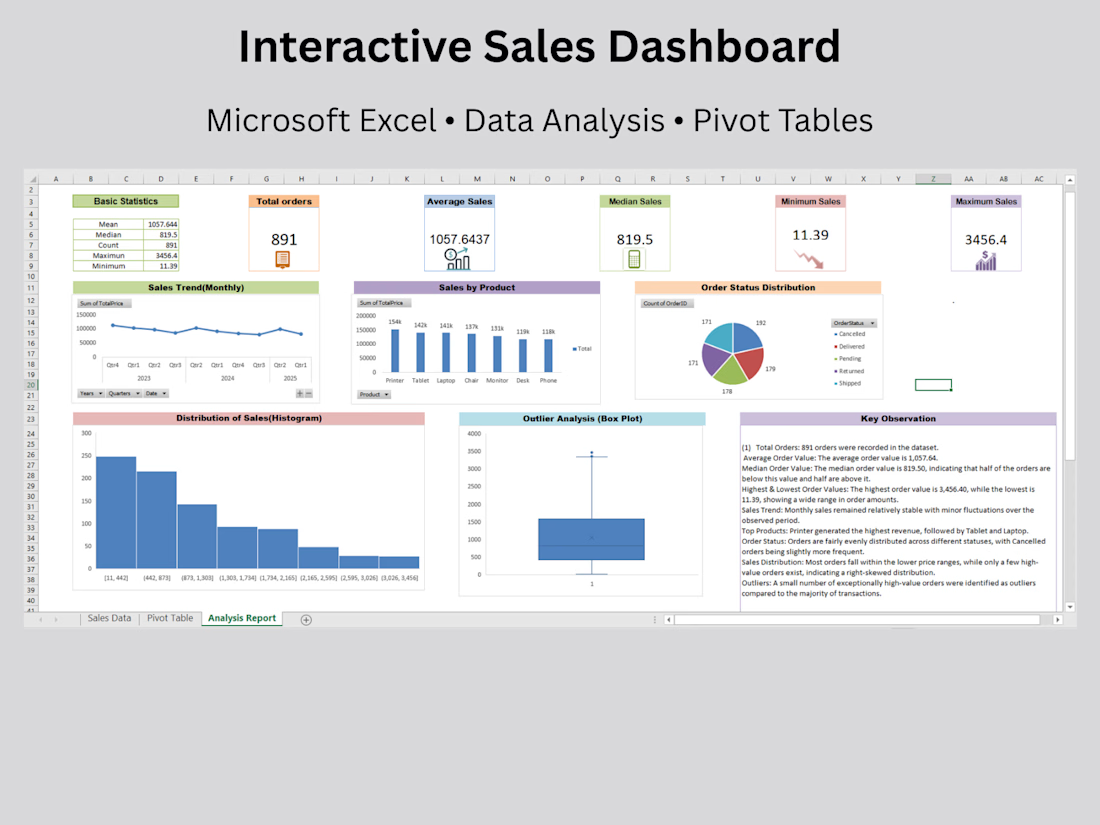
I created this sales dashboard in Microsoft Excel to analyze sales performance and present business insights in a clear, visual format. The dashboard includes KPIs, monthly sales trends, product-wise analysis, order status distribution, a sales histogram, and outlier analysis using a box plot. I used Pivot Tables, Pivot Charts, Excel formulas, and data visualization techniques to transform raw data into meaningful insights that support data-driven decision-making.

The network for creativity
Join 1.25M professional creatives like you
Connect with clients, get discovered, and run your business 100% commission-free
Creatives on Contra have earned over $150M and we are just getting started
Trending
retrofuturism
Share your favorite designs from the past exploring the distant future. Or your own take on the aesthetic 🚀
halftone
Dots. Texture. Grain. Let's see your designs using the halftone technique.

Midjourney
Creatives are showing off what they're making with Midjourney.
colorgrade
Video editors sound off: How do you enhance the mood of your video in color grading?


Related posts

Designed a modern Real Estate Dashboard for Buildex.
Clean and professional UI with performance analytics, active listings, upcoming schedule, lead tracking, and an intelligent AI assistant for property management.


The dashboard looks easy to scan. That's really important for this kind of product.

Finance 𝗔𝗻𝗮𝗹𝘆𝘁𝗶𝗰𝘀 𝗗𝗮𝘀𝗵𝗯𝗼𝗮𝗿𝗱 - Personal Finance Tracking UI.
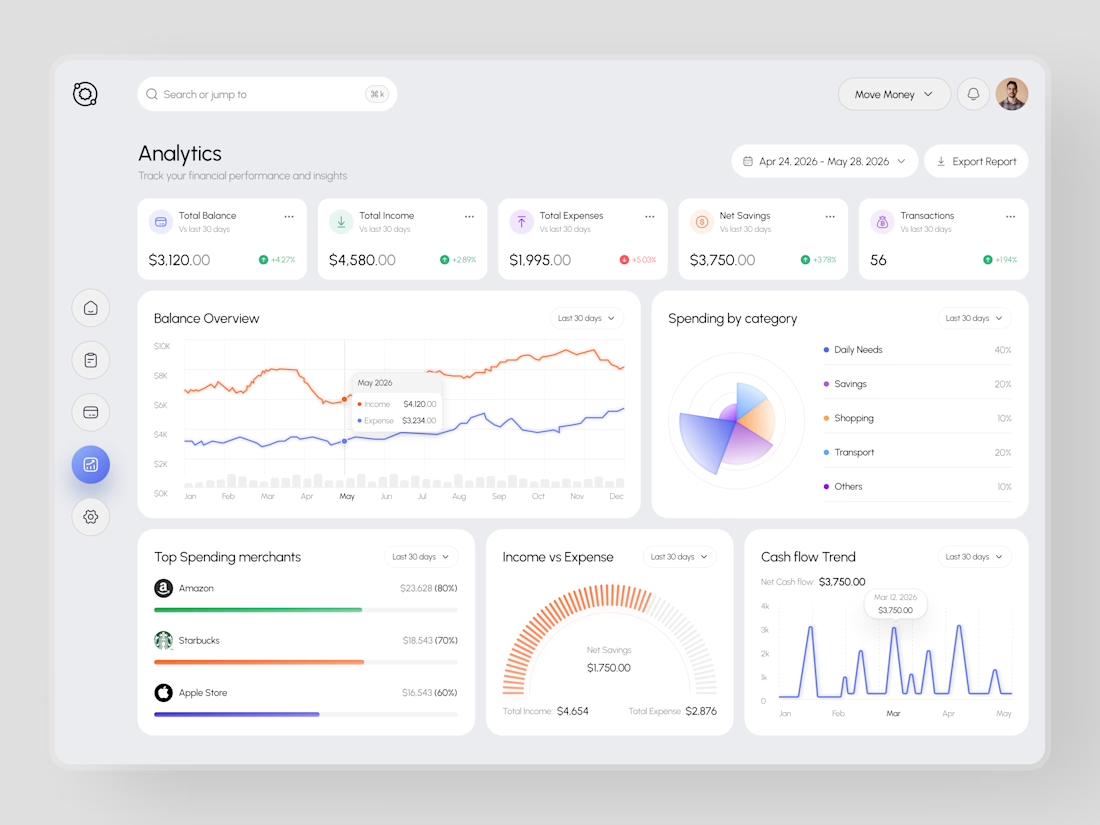
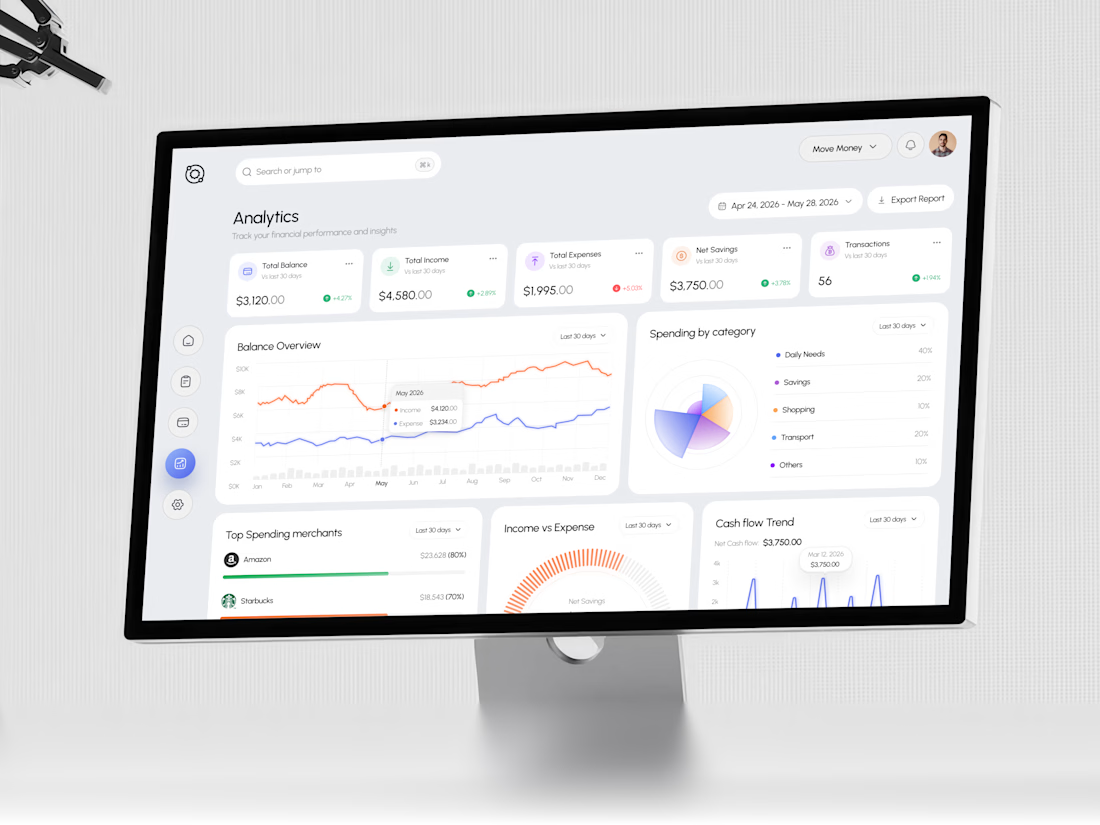
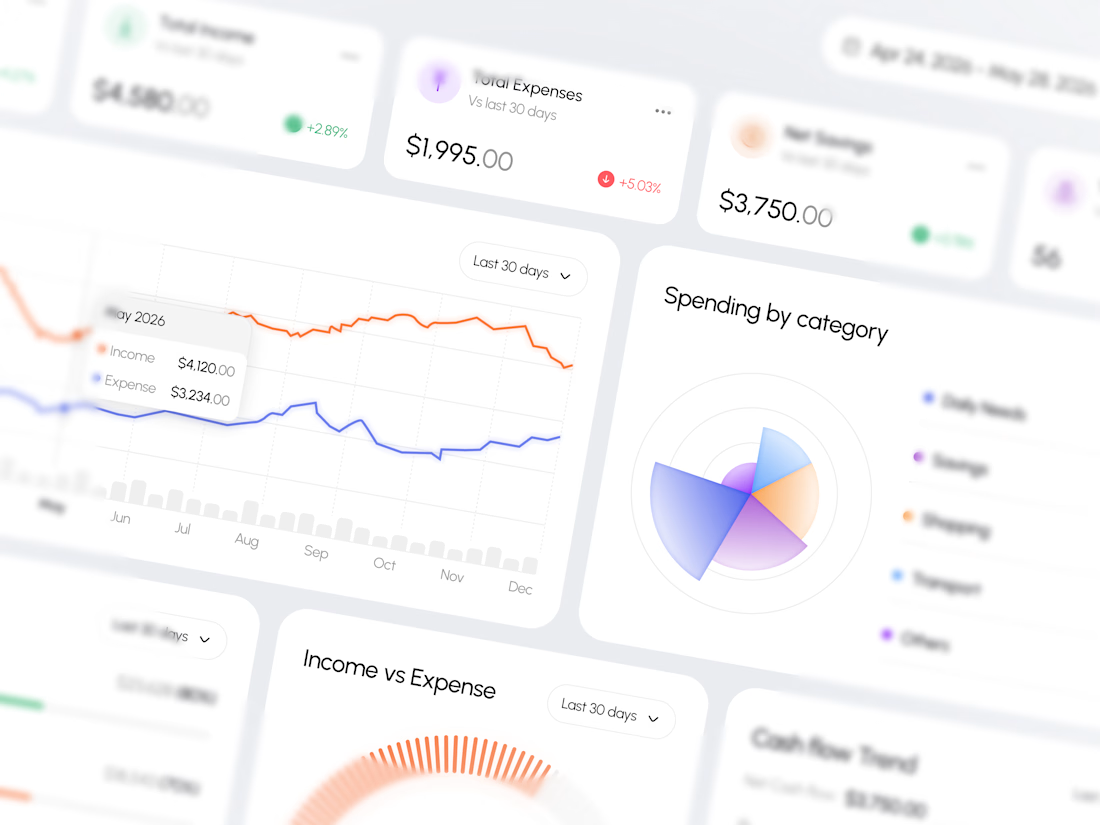
This is a modern analytics dashboard concept designed for personal finance platforms focused on giving users complete visibility into their financial health through clean data visualisation, smart categorisation, and insights that make every number easy to act on.
The goal was to make financial data feel empowering rather than overwhelming. Soft white surfaces, pastel data charts, and a minimal card-based layout that lets the numbers speak without visual noise getting in the way.
𝗦𝗽𝗲𝗰𝗶𝗮𝗹 𝗮𝘁𝘁𝗲𝗻𝘁𝗶𝗼𝗻 𝘄𝗮𝘀 𝗴𝗶𝘃𝗲𝗻 𝘁𝗼:
Five KPIs surfaced instantly: Balance, Income, Expenses, Savings, and Transactions.
A full-year balance chart tracking income vs. expense trends; spending breakdown by category: daily needs, savings, shopping,
𝗧𝗿𝗮𝗻𝘀𝗽𝗼𝗿𝘁:
• top merchant tracker with progress bars for Amazon, Starbucks, and Apple Store;
• income vs expense gauge with net savings at center;
• cash flow trend across Jan–May 2026;
• date range selector and one-click export report
The result is a finance dashboard that makes every number feel actionable, not just visible.
Looking to design a finance or analytics dashboard that feels this considered? Let's build it together.
#Dashboard #Design UI #Design #Data Visualization
Figma

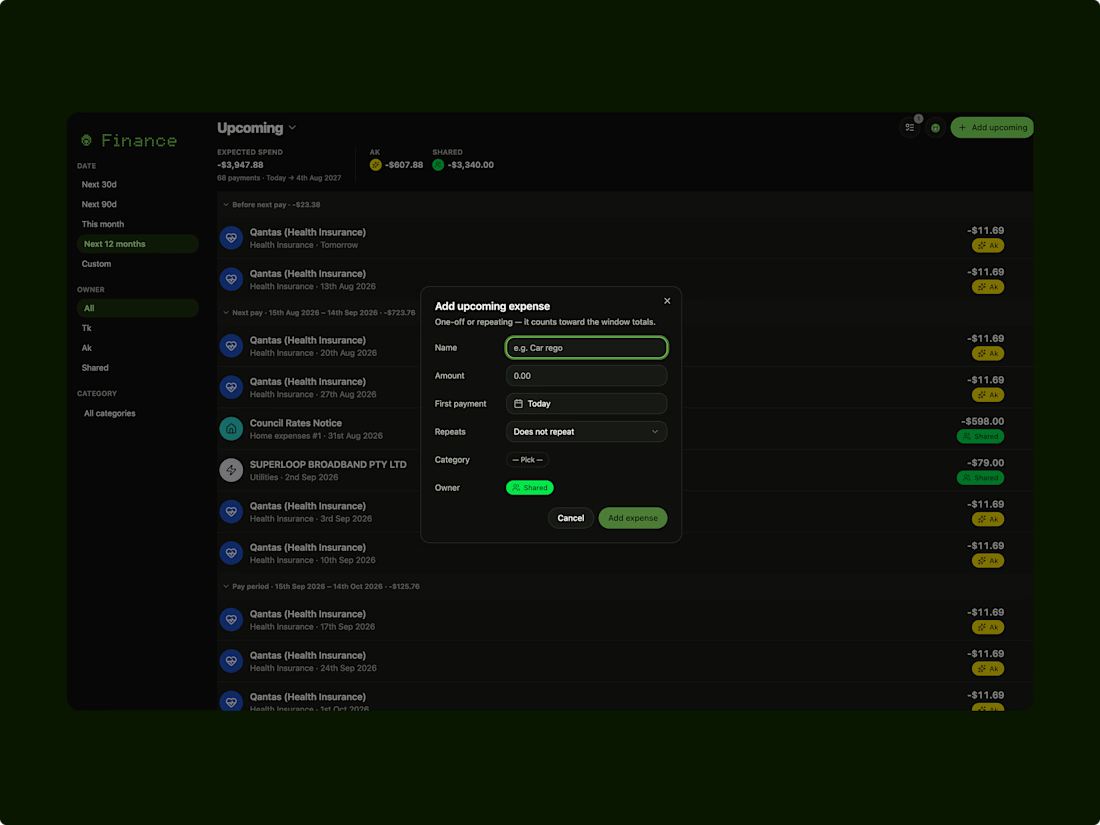
Personal finance dashboard — from an hour of admin to two minutes
A weekly household finance workflow (manually pulling bank CSVs, splitting and categorising spends across two people, cross-checking shared expenses, reviewing totals against savings goals) was taking about an hour every week and still made it hard to tell at a glance whether spending was on track. Designed and built a dashboard that automates the pull, categorisation, and monthly view.
My role:
Research (mapped the existing manual workflow and pain points), UX design, and AI-assisted build of the dashboard.
Outcome:
Cut the weekly admin task from roughly an hour to about two minutes.
Note on scope:
Personal side project, not a client engagement. Included here as a live example of the kind of workflow-to-dashboard problem I take on for clients (repeat-purchase and admin-heavy flows, see Pet Circle and SafetyCulture project cards).
Project details up on my profile.


This sounds like a game-changer for weekly finances! How did you automate the CSV pulls?