The network for creativity
Join 1.25M professional creatives like you
Connect with clients, get discovered, and run your business 100% commission-free
Creatives on Contra have earned over $150M and we are just getting started
Back to feedPost

YOU SHOULDN'T HAVE TO SPEND HOURS COLLECTING DATA JUST TO UNDERSTAND YOUR BUSINESS PERFORMANCE.
Many businesses collect information from different sources.
For example:
Sales records are stored in one application.
Customer information is stored in a CRM.
Expenses are tracked in spreadsheets.
Website performance is monitored separately.
The challenge is bringing all this information together.
This is where automated reporting becomes useful.
Imagine this workflow:
Your sales platform records new transactions.
Your expense spreadsheet receives updated information.
Your CRM tracks customer activity.
Data is connected to a reporting dashboard.
Your dashboard displays updated business information.
Instead of manually compiling different reports every time, you can create a system that organizes important information in one place.
What can an automated dashboard help you monitor?
📊 Sales performance.
📊 Customer acquisition.
📊 Business expenses.
📊 Lead conversion.
📊 Team productivity.
Tools such as Google Sheets, Excel, Power BI, and automation platforms can help create connected reporting systems.
Remember: Data is valuable, but organized and accessible data is even more useful when making business decisions.
What business metric would you most like to monitor from one dashboard?
#DataAutomation #BusinessAutomation


The network for creativity
Join 1.25M professional creatives like you
Connect with clients, get discovered, and run your business 100% commission-free
Creatives on Contra have earned over $150M and we are just getting started



Related posts

Crypto Portfolio Dashboard
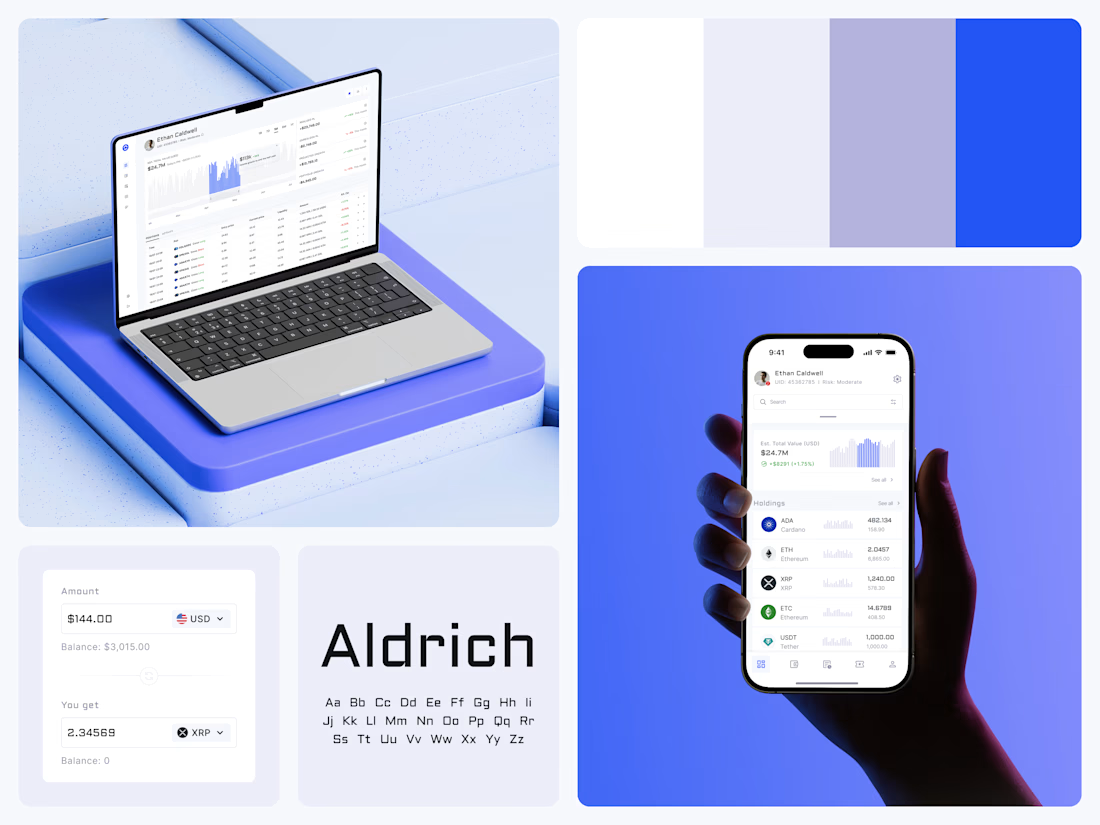
Blue means one thing here: the range you are looking at.
The value chart is a row of thin gray bars, and only the selected date range fills in blue. You read the period that matters and keep the months around it as context.
The phone carries the same chart above the holdings list. Each coin gets its own small bar chart between the name and the amount, so you can scan the whole portfolio for movement without opening a single coin.
Trading screens get busy fast. This one stays light and calm, so the numbers lead: total value, realized and unrealized P&L and open positions, all on one screen.
Designed by the Hue & Machine team.
#Crypto #Fintech #DashboardDesign #TradingPlatform #DataVisualization #UIDesign #ProductDesign #WebApp #MobileDesign #FigmaDesign



Nice Ui Dmytro


Amazing work

Your Logistics Team Shouldn't Have to Chase Every Shipment Manually. 🚢
A shipment is delayed. Your customer wants an update. Your operations team is checking carrier portals, copying tracking numbers into spreadsheets, and sending the same status emails repeatedly.
By the time everyone has the right information, the next shipment needs attention.
The problem isn't a lack of effort. It's disconnected logistics operations.
Common challenges:
Shipment updates scattered across multiple carrier systems.
Delayed shipments discovered too late.
Manual customer status emails.
Tracking spreadsheets that quickly become outdated.
Repetitive follow-ups between operations and customer service.
Limited visibility into shipment exceptions.
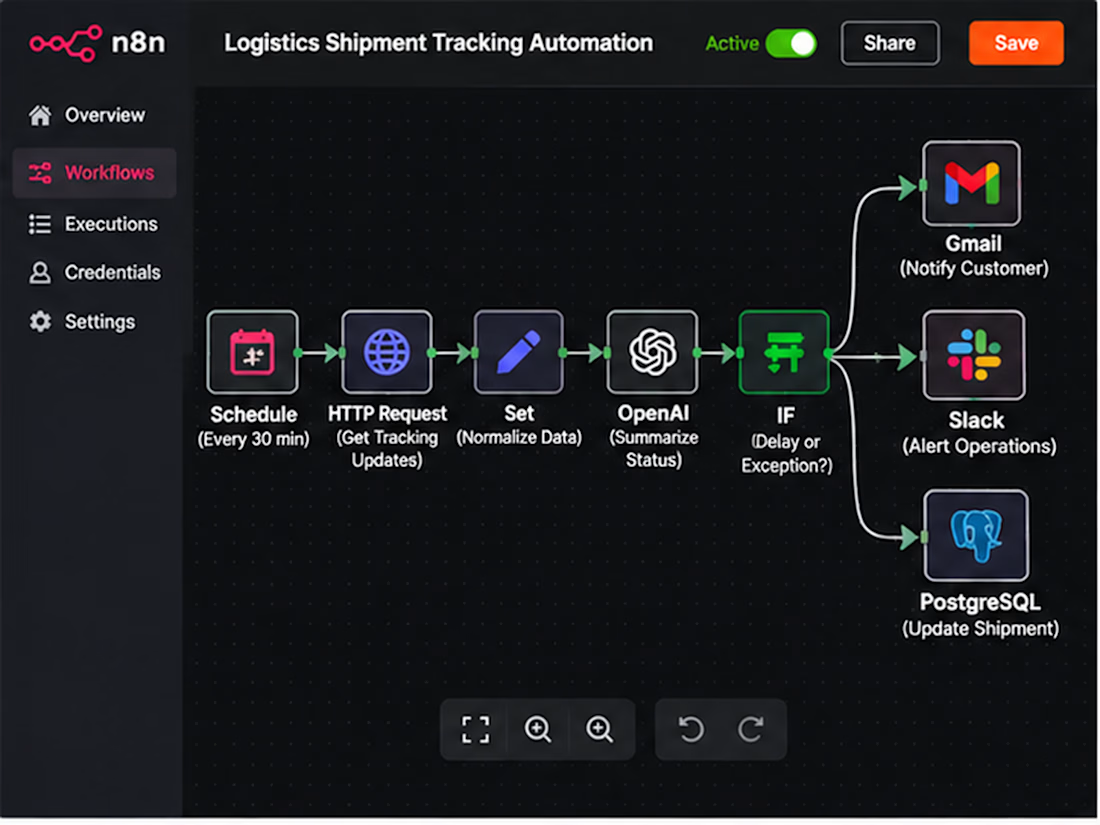
The solution: An automated logistics operations workflow built with n8n.
I can design an automation that connects carrier tracking APIs, your shipment database, and customer communication channels.
Instead of manually checking every shipment, your team receives structured updates when something actually needs attention.
What the automation handles:
📦 Shipment Tracking — Retrieve updates from supported carrier APIs.
🚨 Exception Detection — Identify delays, customs holds, and missed milestones.
🤖 AI-Assisted Updates — Convert complex tracking events into clear, customer-friendly messages.
📧 Customer Notifications — Send relevant shipment updates automatically.
📊 Operations Visibility — Maintain synchronized shipment records and exception histories.
🔁 Escalation Management — Notify the responsible team when an exception requires action.
The goal: Less repetitive tracking work, faster exception awareness, and more consistent customer communication.
Two ways we can work together:
Option 1: Already have carrier APIs, a TMS, or a defined tracking workflow? Share your requirements, and I'll help design the integration.
Option 2: Not sure which logistics tasks should be automated? We can map your shipment lifecycle and identify the highest-value starting point.
Make your logistics operations easier to manage as shipment volume grows.
Workflow architecture
Scheduled Trigger → Carrier API Request → Normalize Tracking Events → Match Shipment Records → Detect Status Changes → Route Exceptions → AI Summary → Customer Email / Operations Alert → Database Update
Implementation: Authenticate carrier integrations, normalize differing event codes, compare timestamps and event IDs, prevent duplicate alerts, route exceptions by severity, and log delivery failures for retry.
Benefits: Reduced manual tracking, clearer exception ownership, more timely customer updates, and an auditable shipment history.
Result: A centralized shipment monitoring workflow that allows operations teams to focus on resolving exceptions instead of repeatedly checking tracking portals.
SEO Keywords
n8n logistics automation • freight forwarding automation • shipment tracking automation • AI logistics workflow • 3PL automation • logistics API integration • freight tracking software • supply chain automation • carrier tracking API • automated shipment notifications • freight forwarder software • logistics operations automation • shipment exception management • customs clearance alerts • AI shipment updates • freight status monitoring • transportation workflow automation • logistics email automation • carrier integration services • shipment delay alerts • freight operations workflow • logistics customer communication • n8n freight automation • logistics data synchronization • TMS integration • transportation management integration • shipment event processing • automated logistics reporting • shipping status API • logistics workflow developer • freight technology consultant • 3PL workflow integration • automated delivery updates • shipment milestone tracking • freight customer portal integration • logistics exception alerts • carrier API developer • logistics process optimization • AI supply chain automation • logistics database automation • freight forwarding API • shipment tracking dashboard • logistics business automation • automated freight communication • shipment lifecycle automation • n8n API workflows • logistics SaaS integration • freight management automation • shipping notification workflow • custom logistics automation • shipment reconciliation • freight exception escalation
Hashtags
#n8n #n8nAutomation #LogisticsAutomation #FreightForwarding #FreightTech #SupplyChainAutomation #ShipmentTracking #3PL #LogisticsTechnology #WorkflowAutomation #AIAutomation #CarrierIntegration #APIAutomation #FreightManagement #ShipmentVisibility #SupplyChainTech #LogisticsSoftware #BusinessAutomation #CustomAutomation #LogisticsOperations #ShipmentAlerts #FreightSoftware #TransportationManagement #SupplyChainVisibility #AIWorkflow #AutomationEngineer #B2BAutomation #SystemIntegration #OperationsAutomation #FreightOperations #ShippingAutomation #CustomSoftware



The customs-hold exception is the one I'd find hardest to route, since it needs a different owner than a plain delay. Do you map each exception type to its own team in the escalation step, or is it one shared alert queue?