The network for creativity
Join 1.25M professional creatives like you
Connect with clients, get discovered, and run your business 100% commission-free
Creatives on Contra have earned over $150M and we are just getting started
Back to feedPost
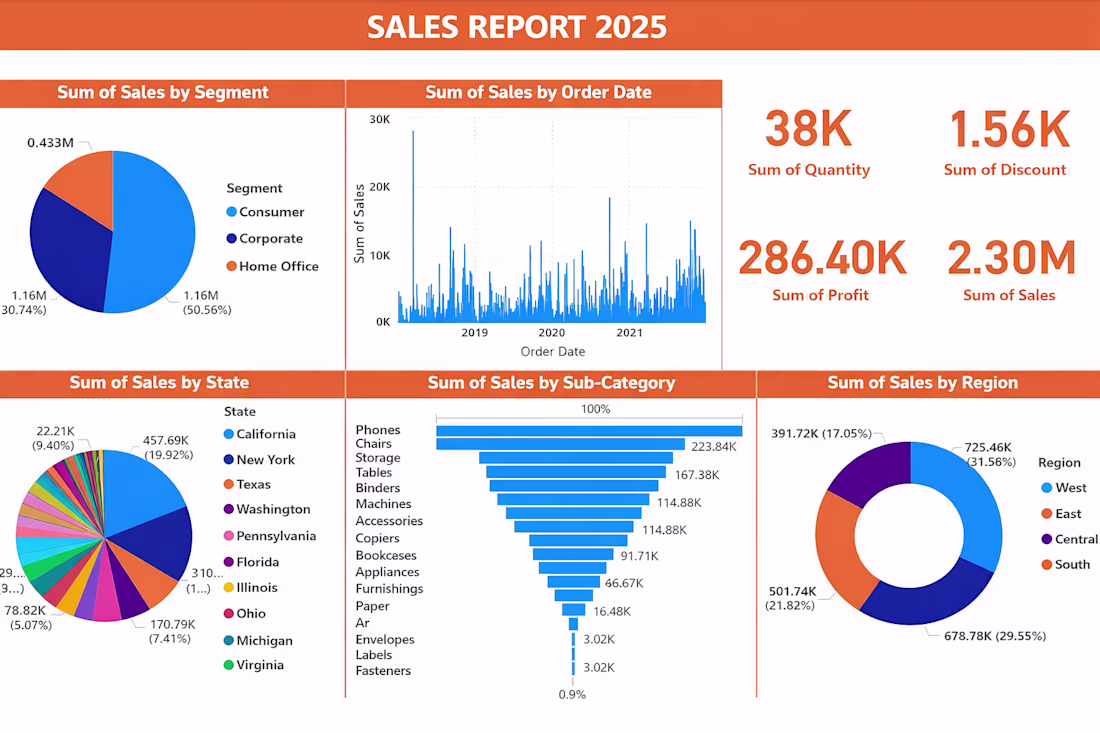
📊 AI-Powered Sales Dashboard | Project Completed
I’ve successfully completed this AI-assisted Sales Data Visualization project, transforming raw sales data into a clear, decision-ready dashboard.
✅ What this dashboard delivers:
Business-focused KPIs (Sales, Profit, Quantity, Discount)
Segment, Region, State & Category-wise performance analysis
Clean, modern, client-friendly visual layout
Easy insights for fast business decisions
🧠 My Role & Skills:
Data cleaning & structuring
KPI identification & analysis
AI-assisted data visualization
Dashboard design & data storytelling
📌 This project is fully completed and ready for real-world business use.
I don’t just visualize data — I turn data into business decisions.
This is exactly how sales dashboards should be built—decision first, visuals second. Clear KPIs, strong segmentation, and a client-friendly layout make this genuinely usable, not just impressive.
What stands out most is the focus on actionability: turning raw sales data into...
Thank you so much—really appreciate the thoughtful feedback. The goal was exactly that: designing with decisions in mind, not just visuals. Glad it resonated.
Glad to hear that. Designing with decisions in mind always shows in the final outcome. Wishing you many more projects where clarity drives impact—keep going.
Thank you so much
Really solid dashboard work — I like how you focused on decision-ready KPIs instead of just visuals. The segmentation and regional breakdown make it very practical for real business use. Great example of data storytelling done right.
Thank you very much for the kind feedback. The goal was to keep the dashboard decision-focused and business-ready, so I’m glad the KPI structure and segmentation came across clearly.
The network for creativity
Join 1.25M professional creatives like you
Connect with clients, get discovered, and run your business 100% commission-free
Creatives on Contra have earned over $150M and we are just getting started
Trending
Claude
Claude has entered the design space. How are you using it?
Contra University
Learn from expert creatives how to earn more using next-gen AI tools.
Brand Design
The best brand designers are on Contra. Scroll to see what's trending in brand design. What are you building?
creativeaiflow
Creative AI workflows are evolving. What tools do you use, and what are their strengths and weaknesses?
freelancerlife
Freelancer life is wins, pivots, and everything in between. What’s yours right now?
Related posts
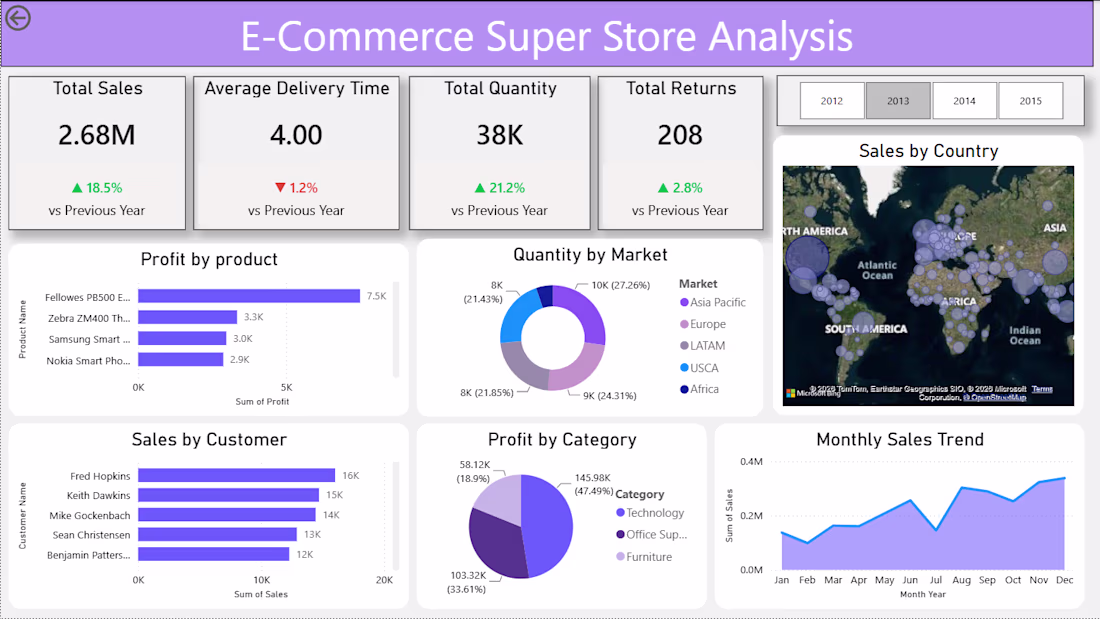
E-Commerce Super Store Sales Dashboard
Developed an interactive Power BI dashboard to analyze sales performance, profitability, customer trends, and operational KPIs for an e-commerce business. The dashboard provides decision-makers with real-time insights into sales growth, product performance, returns, and regional trends through dynamic and visually engaging reports.
Key Highlights
Designed an executive-style dashboard with an intuitive user experience
Built dynamic KPIs using DAX for Sales, Quantity, Returns, and Delivery Performance
Cleaned and transformed data using Power Query
Created an optimized data model for accurate and efficient reporting
Implemented interactive filters, cross-filtering, and time-based analysis
Visualized sales by country, product, category, customer, market, and monthly trends.
Skills Used
Power BI • DAX • Power Query • Data Modeling • ETL • Sales Analytics • KPI Development • Data Visualization • Business Intelligence
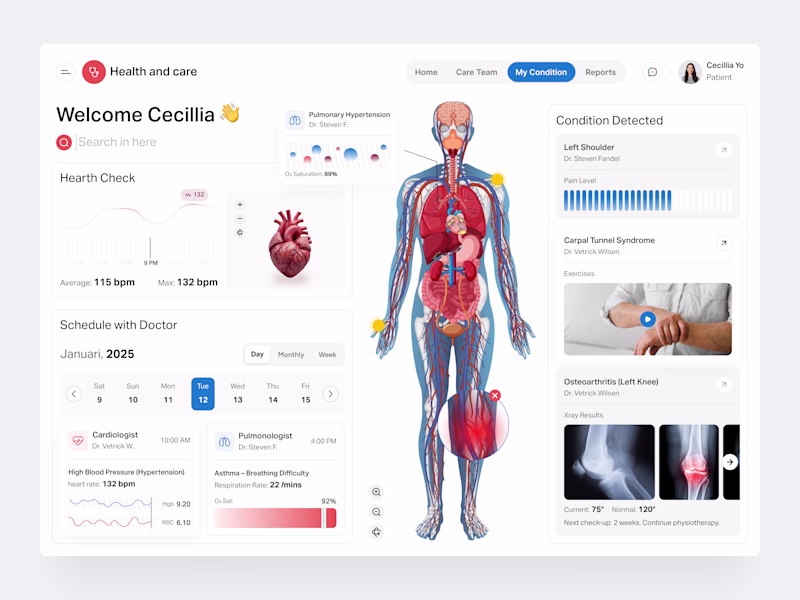
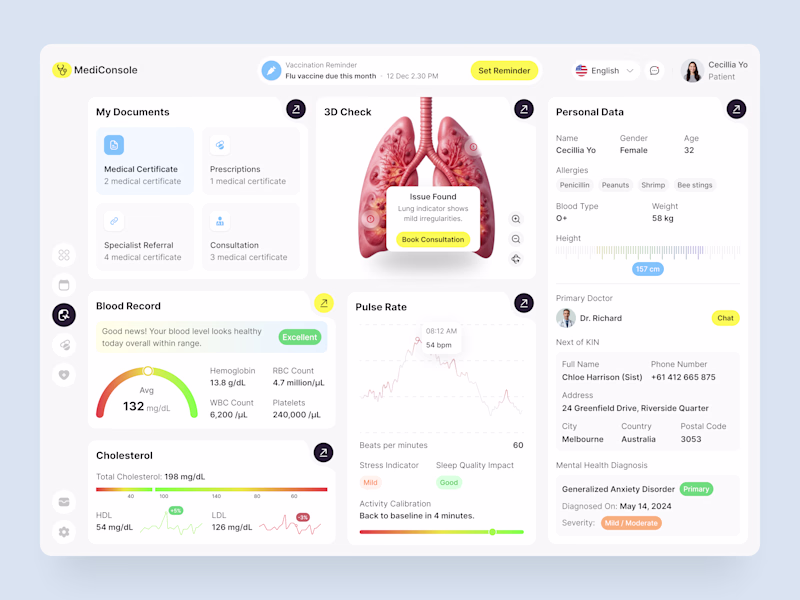
I've been exploring healthcare product design recently, and these are my top 2 healthcare dashboard concepts.
Which dashboard is your favorite: Option A or Option B? Why?
2 voted
33%
4 voted
67%
6 votes
Closed
Incredible work!
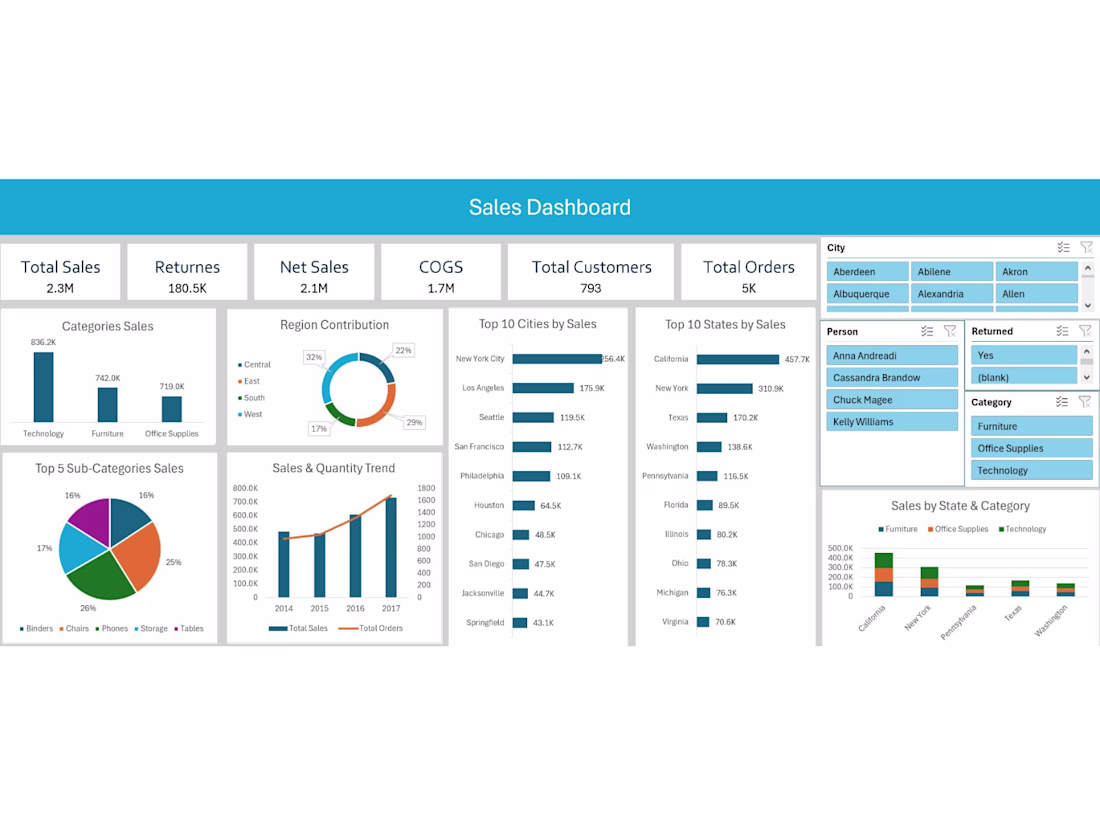
📊 Excel Sales Dashboard
An interactive Excel dashboard that transforms raw sales data into meaningful business insights through KPI tracking, dynamic filtering, and intuitive visualizations. Built using PivotTables, Pivot Charts, and Slicers to support effective sales analysis and decision-making.