The network for creativity
Join 1.25M professional creatives like you
Connect with clients, get discovered, and run your business 100% commission-free
Creatives on Contra have earned over $150M and we are just getting started
Back to feedPost

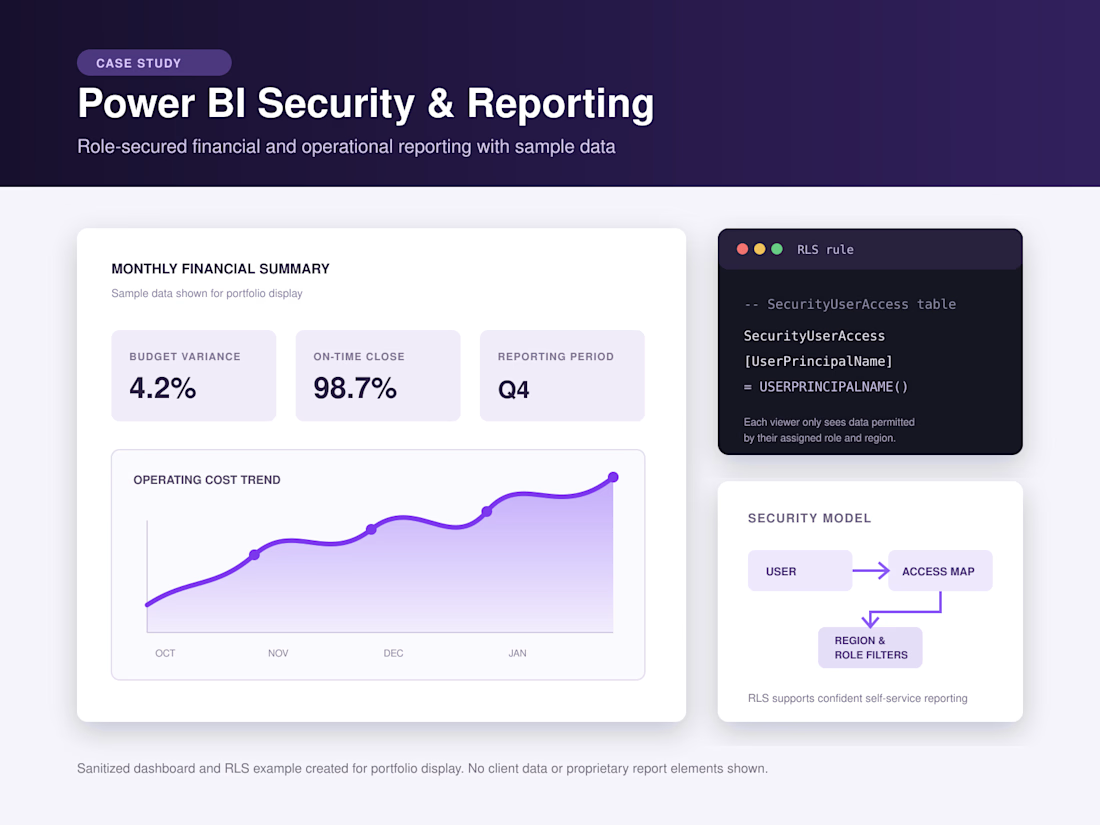
I built Power BI dashboards for financial and operational reporting, with row-level security to ensure each user could see only the data permitted by their assigned role and region.
The work included designing the data model, creating Power Query and DAX logic, configuring security access, and supporting dependable report refreshes. The dashboard and RLS rule shown are sanitized portfolio examples using sample data, with no client data or proprietary report elements included.

The network for creativity
Join 1.25M professional creatives like you
Connect with clients, get discovered, and run your business 100% commission-free
Creatives on Contra have earned over $150M and we are just getting started











Related posts

Project Management Dashboard – A powerful and intuitive interface designed to enhance team collaboration, productivity, and workflow efficiency.


Exploring how complex financial data can feel simple, structured, and easy to navigate.
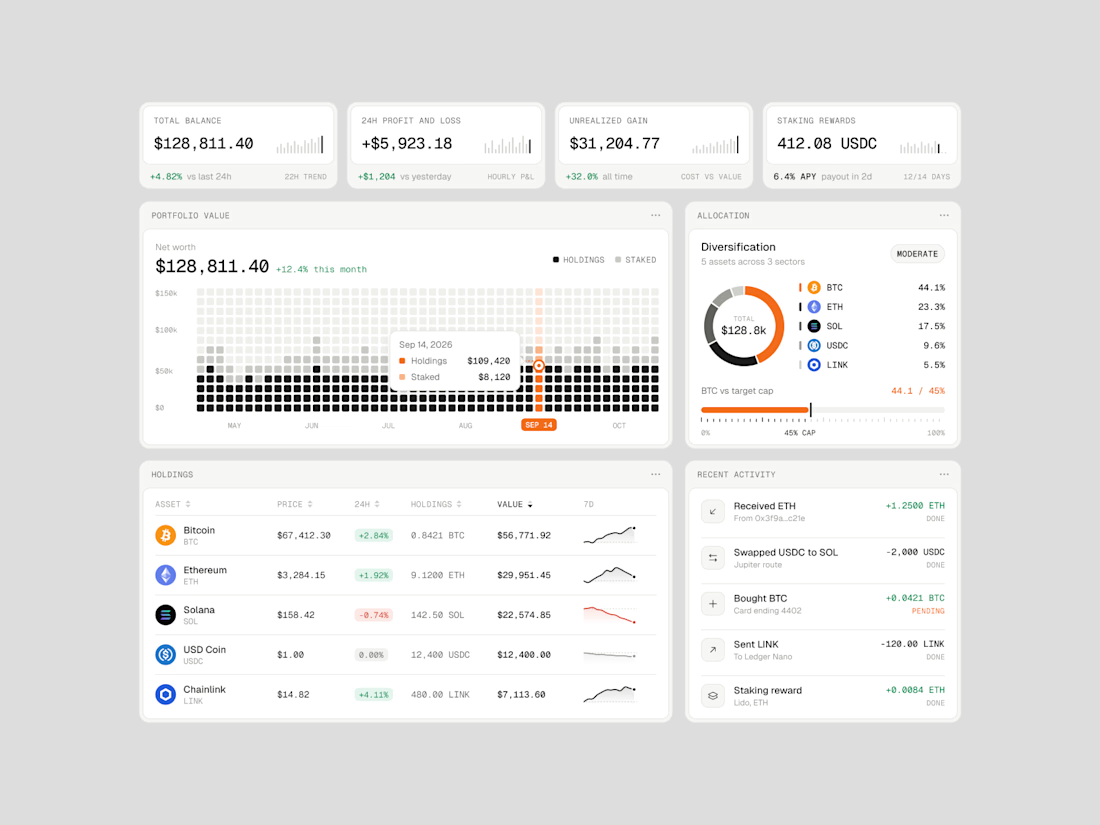
Vault One is a crypto portfolio dashboard concept that brings together asset performance, portfolio allocation, transaction history, and key financial metrics in one workspace.
I focused on visual hierarchy, information density, and data visualization, using a neutral color palette, subtle UI details, and selective accent colors to keep the interface clean without compromising functionality.
The goal was to make the data easier to understand, not just nicer to look at.
Would love to hear your thoughts on the visual direction and layout!
#ProductDesign #UIDesign #Fintech #DashboardDesign #UXDesign



Personally not a fan of gambling
But the predictions market data is fascinating
Started digging through Polymarket's API and found this back-and-forth in the Ballon d'Or race
So I turned the data into The Chase, a visual story where you can watch expectations shift over time
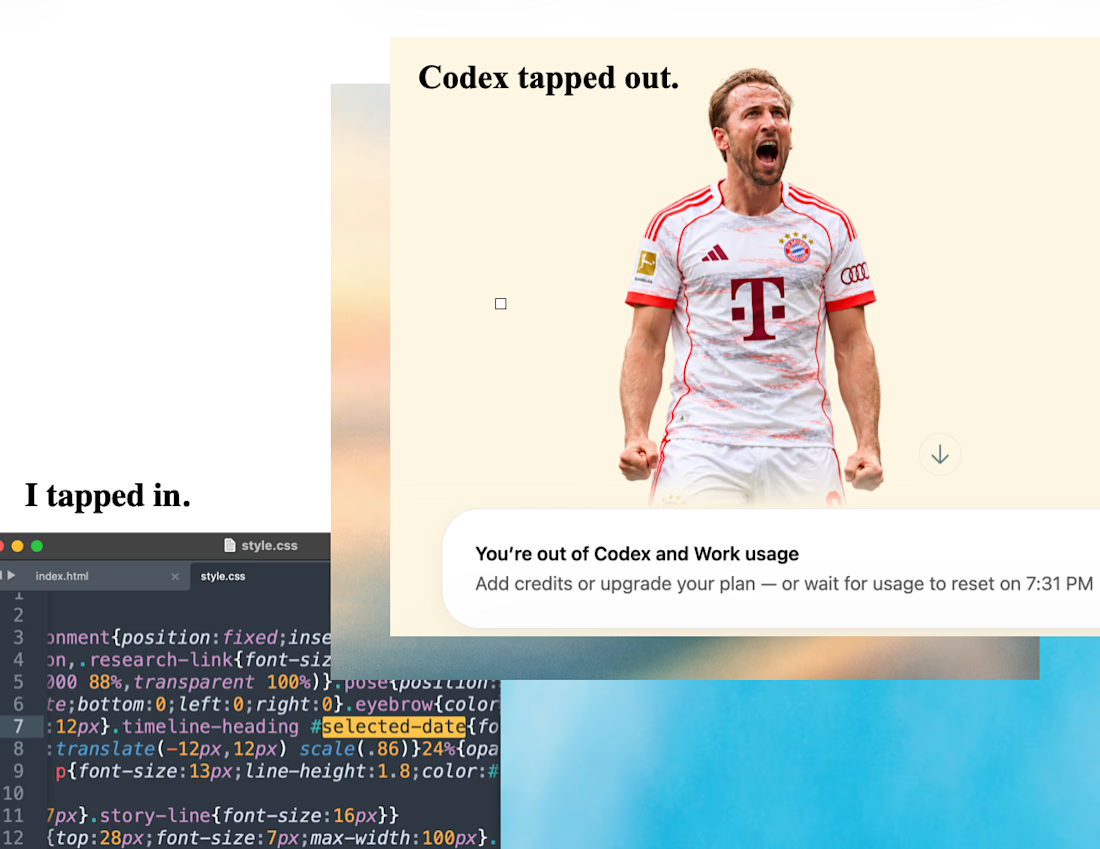
Codex ran out of credits mid-build. Enjoy the meme