The network for creativity
Join 1.25M professional creatives like you
Connect with clients, get discovered, and run your business 100% commission-free
Creatives on Contra have earned over $150M and we are just getting started
Back to feedPost

E-Commerce Sales Performance Dashboard in Power BI 🚀
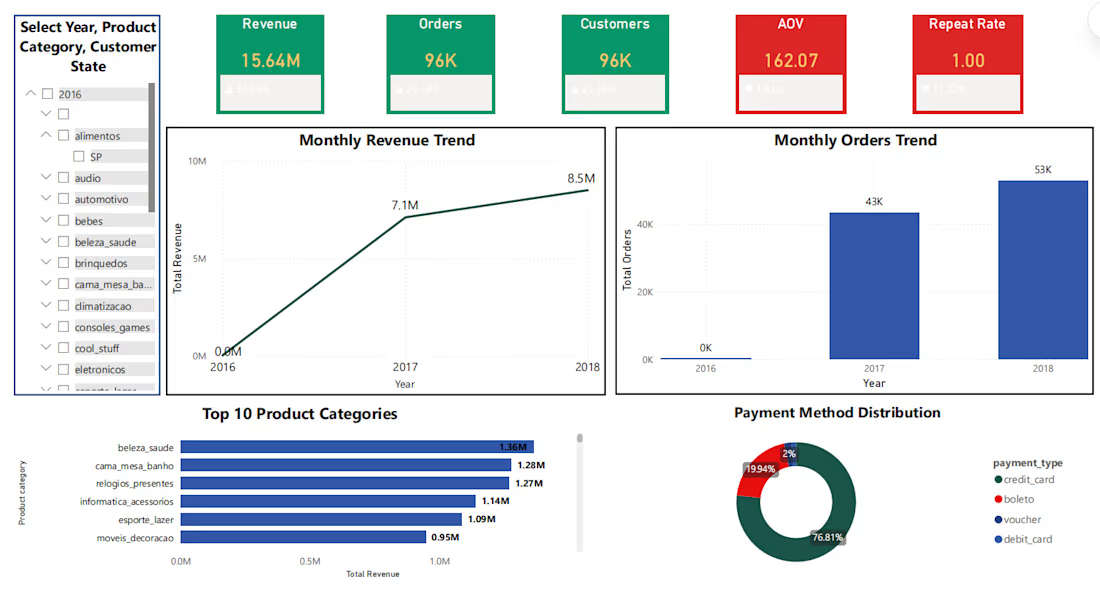
During my remote internship with Elvo Pathways, I created an interactive Power BI dashboard to analyze e-commerce sales performance and business KPIs.
The dashboard provides a clear overview of key metrics such as total revenue, total orders, customers, average order value, and repeat rate. It also includes visual analysis of monthly revenue trends, monthly order trends, top-performing product categories, and payment method distribution.
I designed the dashboard with interactive filters for year, product category, and customer state, allowing users to explore the data from different business perspectives. The goal of this project was to transform raw sales data into a clean, visual, and decision-support dashboard that helps identify revenue growth, customer behavior, product performance, and payment preferences.
This project demonstrates my ability to build business-focused dashboards using Power BI, create meaningful KPIs, design interactive reports, and present data in a way that supports better decision-making.
Data VisualizationMachine Learning EngineeringData EngineeringMicrosoft ExcelMicrosoft SQL ServerMicrosoft Power BI


The network for creativity
Join 1.25M professional creatives like you
Connect with clients, get discovered, and run your business 100% commission-free
Creatives on Contra have earned over $150M and we are just getting started
Related posts

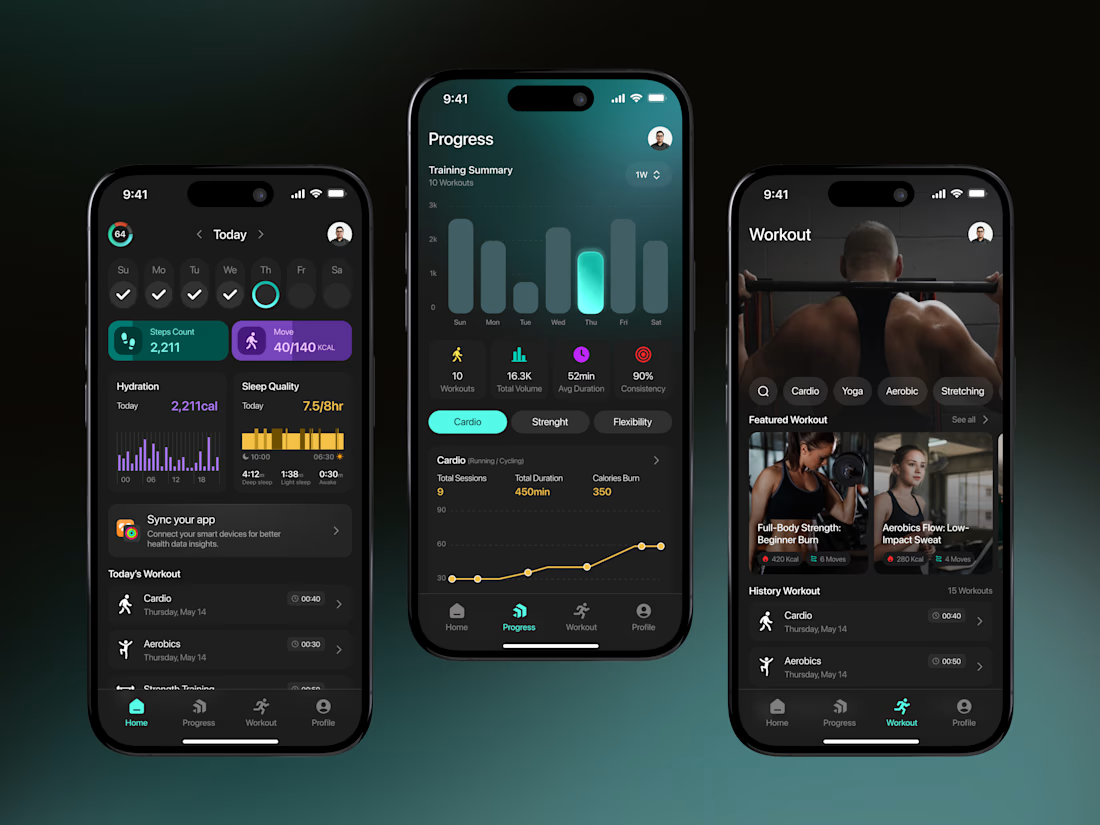
A modern fitness tracker mobile app UI designed to help users monitor workouts, track daily activity, and visualize progress in a clean and motivating experience.Focused on health insights, workout tracking, and intuitive data visualization with a sleek dark interface built for better engagement and consistency.
📩 Collaborate with Us? Contra Cansaas Agency

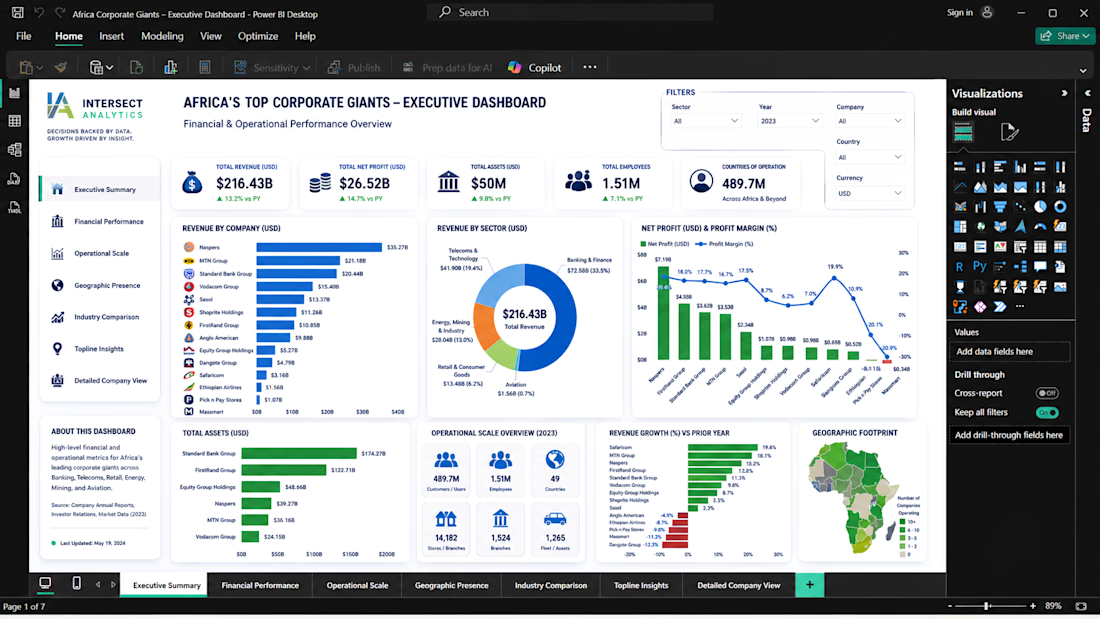
Africa’s corporate growth story is being shaped by a few powerful giants. But what truly drives performance across industries?
At Intersect Analytics, we wanted to answer that question.
So we scraped, structured, transformed, and analyzed real-world corporate data using Python, then developed an executive-level Power BI dashboard to uncover the performance drivers behind some of Africa’s most influential companies across:
🏦 Banking & Finance
📡 Telecoms & Technology
🛒 Retail & Consumer Goods
🛢️ Energy, Mining & Industry
✈️ Aviation
What did we uncover?
📈 Banking & Telecoms continue to dominate revenue generation
Large financial institutions and telecom operators remain the backbone of Africa’s corporate economy, driven by scale, customer reach, and digital expansion.
🌍 Geographic presence matters
Organizations operating across multiple countries demonstrate stronger resilience, diversified revenue streams, and greater long-term scalability.
📱 Technology-enabled businesses outperform
Companies leveraging digital ecosystems, mobile platforms, and customer connectivity continue creating stronger operational efficiencies and customer growth.
⚙️ Operational scale is a competitive advantage
Whether measured through customer base, branch networks, stores, subscribers, or infrastructure, scale continues separating market leaders from followers.
📊 Executive visibility drives better decisions
Complex business environments require more than spreadsheets. Leaders need real-time visibility into revenue, profitability, operations, geographic performance, and growth trends.
How we built it
Using Python, we scraped and consolidated multi-source corporate data, cleaned and transformed datasets, standardized financial and operational KPIs, and prepared a robust analytics model.
Using Power BI, we transformed complexity into an interactive executive dashboard designed for decision-makers.
The result?
A dashboard that answers:
✔️ What drives growth?
✔️ Which sectors outperform?
✔️ Where are risks and opportunities emerging?
✔️ What operational metrics matter most?
What we do at Intersect Analytics
We help organizations turn fragmented business information into decision-ready intelligence through:
📊 Power BI Executive Dashboards
🐍 Python Data Scraping & Automation
⚙️ Excel & Google Sheets Automation
📈 Financial Analysis & Forecasting
🗄️ Business Intelligence & KPI Reporting
Because growth becomes easier when leaders can see clearly.
DECISIONS BACKED BY DATA.
GROWTH DRIVEN BY INSIGHT.
📱 WhatsApp: +254 723 632 207
#PowerBI #Python #BusinessIntelligence #DataAnalytics #ExecutiveDashboard #Automation #DigitalTransformation #BusinessGrowth


Blockly – Blockchain Dashboard
Blockchain dashboard designed to simplify complex on-chain data into clear, actionable insights. Built for clarity and performance, Blockly enables users to monitor transactions, analyze network activity, and track assets across multiple blockchains—all from a single, intuitive interface.
Have a project? Let's Discuss and Collaborate: https://cal.com/orenji-studio/30min?overlayCalendar=true





Trending

Claude
Claude has entered the design space. How are you using Claude Design?

Contra University
Learn from expert creatives how to earn more using next-gen AI tools.
creativeaiflow
Creative AI workflows are evolving. What tools do you use, and what are their strengths and weaknesses?
portfolioreview
The best portfolios tell a story, not just show a grid. Share yours for feedback.
freelancerlife
Freelancer life is wins, pivots, and everything in between. What’s yours right now?