
Areeba Ali
AI & Data Science Freelancer | Python, ML, NLP & Dashboards
New to Contra
Areeba is building their profile!
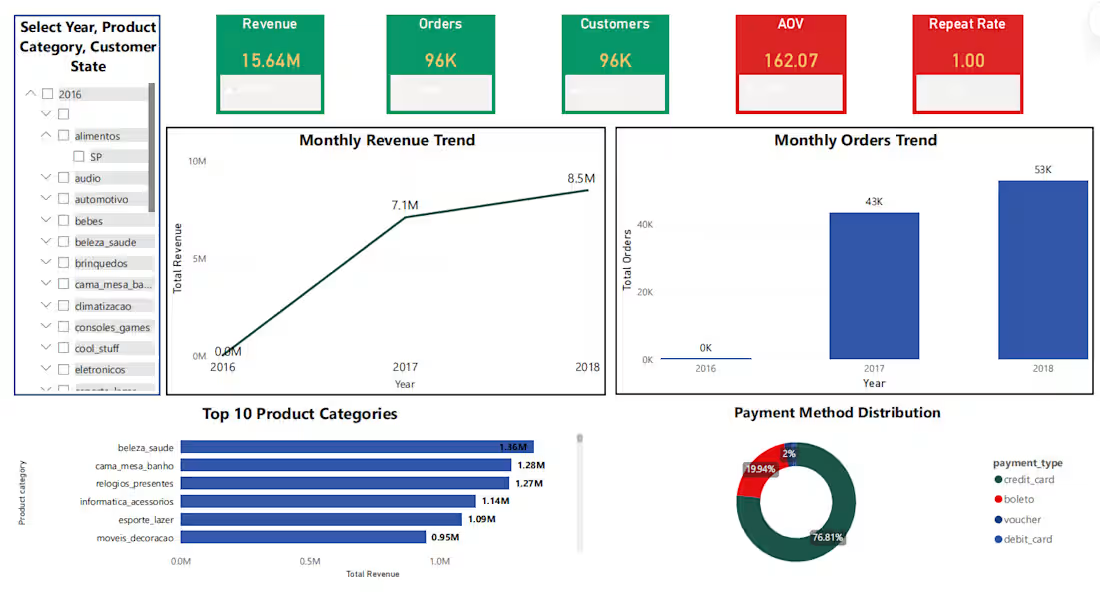
E-Commerce Sales Performance Dashboard in Power BI 🚀
During my remote internship with Elvo Pathways, I created an interactive Power BI dashboard to analyze e-commerce sales performance and business KPIs.
The dashboard provides a clear overview of key metrics such as total revenue, total orders, customers, average order value, and repeat rate. It also includes visual analysis of monthly revenue trends, monthly order trends, top-performing product categories, and payment method distribution.
I designed the dashboard with interactive filters for year, product category, and customer state, allowing users to explore the data from different business perspectives. The goal of this project was to transform raw sales data into a clean, visual, and decision-support dashboard that helps identify revenue growth, customer behavior, product performance, and payment preferences.
This project demonstrates my ability to build business-focused dashboards using Power BI, create meaningful KPIs, design interactive reports, and present data in a way that supports better decision-making.
0
11
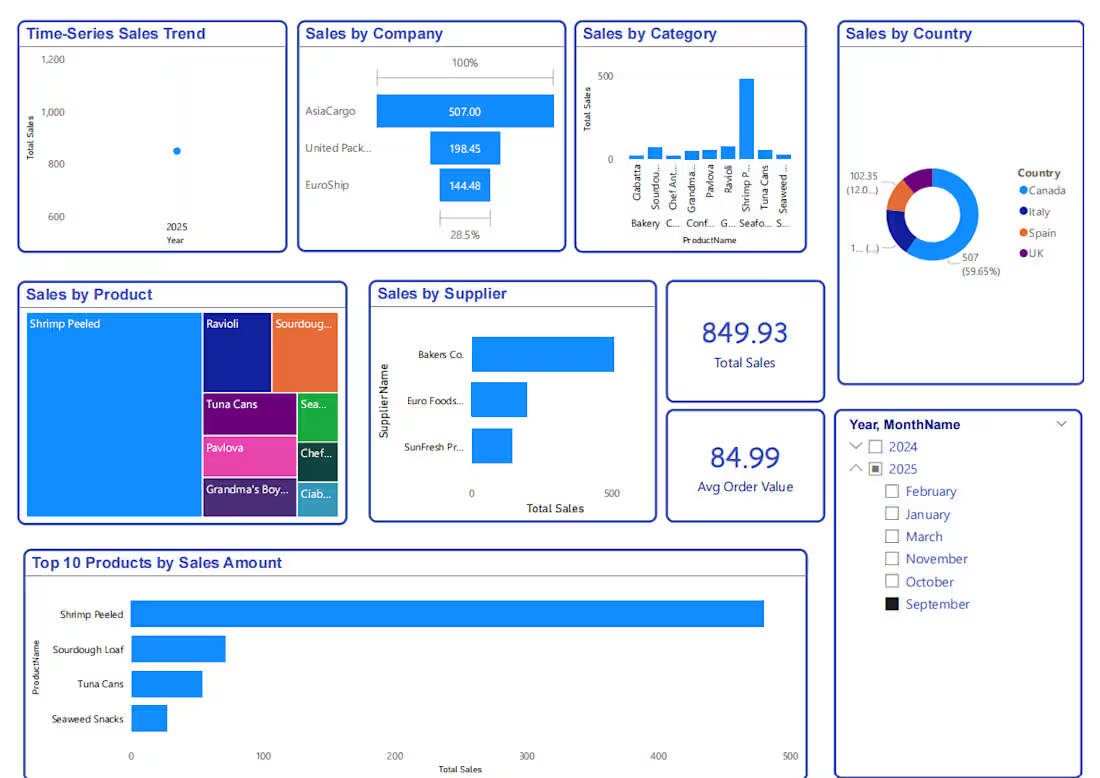
I developed an end-to-end Data Warehouse and Business Intelligence project using the Northwind dataset. The goal was to transform raw business data into a structured analytical system that supports reporting, OLAP analysis, and business-driven insights.
My work included designing a star-schema data warehouse, building ETL workflows in SSIS, developing an SSAS multidimensional cube with measures and hierarchies, performing OLAP operations such as roll-up, drill-down, slice, and dice, and writing MDX queries for analysis. I also deployed and validated the solution using SQL Server Management Studio.
The final result demonstrates a complete BI workflow — from source data extraction and transformation to cube development and analytical reporting. This type of solution is useful for businesses that need organized data, performance tracking, sales analysis, and decision-support reporting.
1
38