The network for creativity
Join 1.25M professional creatives like you
Connect with clients, get discovered, and run your business 100% commission-free
Creatives on Contra have earned over $150M and we are just getting started
Back to feedPost
Self-inflicted monitoring outages: Why opening multiple uncached Grafana dashboards crashes your central Prometheus server right when you need it most.
During a major production incident, the entire engineering team gathers to triage the problem. Dozens of engineers open Grafana simultaneously, pulling up system overview boards, service dashboards, and Kubernetes node metrics. Wall-mounted office monitoring TVs auto-refresh every 5 seconds.
Moments later, the entire observability stack goes dark: Grafana displays red error banners across every panel: ``504 Gateway Timeout`` or ``dial tcp: connect: connection refused``. The Prometheus TSDB instance has crashed, kernel OOM-killed.
The incident is now compound: the production issue is ongoing, and the engineering team is completely blind.
This catastrophic failure mode is caused by **Grafana PromQL Query Storms**: 1. The Subquery Cartesian Explosion: A single Grafana dashboard frequently contains 25+ panels. Many panels execute heavy, unoptimized PromQL queries calculating moving rates over long lookback windows: ``rate(http_requests_total[30d])[1m:15s]``. Each subquery forces Prometheus to load hundreds of millions of raw time series samples from disk into memory. 2. The Multiplier Effect: When 20 engineers and 5 wall displays query that dashboard with auto-refresh set to 10 seconds, Prometheus is bombarded with hundreds of heavy analytical queries per minute. The TSDB query engine's memory allocations skyrocket exponentially. 3. The OOM Collapse: The Linux kernel detects Prometheus exhausting available host RAM and invokes the OOM killer, killing the monitoring process. Upon restart, Prometheus must replay its write-ahead log (WAL), keeping the server offline for 15 to 45 minutes during the height of your production outage.
Resilient SRE telemetry architectures decouple interactive dashboard querying from the raw metrics ingestion engine: • Implement Prometheus Recording Rules: Never compute heavy mathematical aggregations (e.g., p99 latency calculations or multi-tenant rates) on the fly in Grafana. Pre-compute them continuously in the background using Prometheus Recording Rules (``record: job:http_requests:rate5m``). Grafana panels query the pre-computed, single-point time series in 1 millisecond, consuming negligible CPU and memory. • Deploy Thanos Query Frontend or Prometheus Query Cache: Insert an intelligent caching proxy (like Thanos Query Frontend or Trickster) in front of Prometheus. Repeated queries from multiple engineers or auto-refreshing wall displays are served directly from fast in-memory or Redis caches with zero TSDB load. • Enforce Query Concurrency and Timeout Limits: In ``prometheus.yml``, configure strict resource boundaries: ``--query.max-concurrency=20`` and ``--query.timeout=10s`` to kill rogue queries before they can consume host memory. • Dedicated Query Engines: Separate metrics ingestion nodes from query nodes using Thanos or Cortex, ensuring that an analytical query spike never impacts scrape ingestion or critical alerting rules.
Keep your observability platform rock-solid, responsive, and available during high-stress production incidents.
Deploy production-grade observability infrastructure with our 1-to-2 week Production Observability & SRE Telemetry Sprint on Contra: https://contra.com/s/r6k2QLPl-production-observability-and-sre-telemetry-platform
#Observability #SRE #Prometheus #DevOps #Infrastructure #Performance #Architecture


The network for creativity
Join 1.25M professional creatives like you
Connect with clients, get discovered, and run your business 100% commission-free
Creatives on Contra have earned over $150M and we are just getting started
Challenges
View all


Related posts

Streamlining DevOps Workflows with CodeNest ⚡️💻
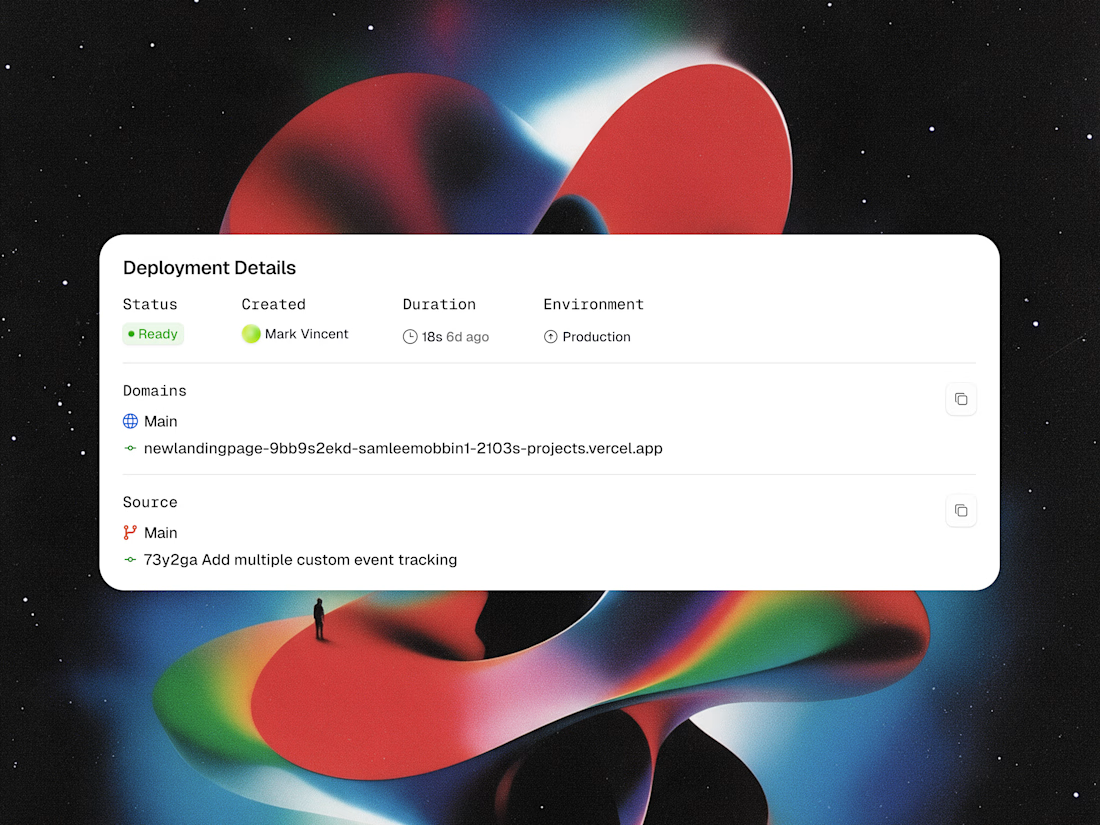
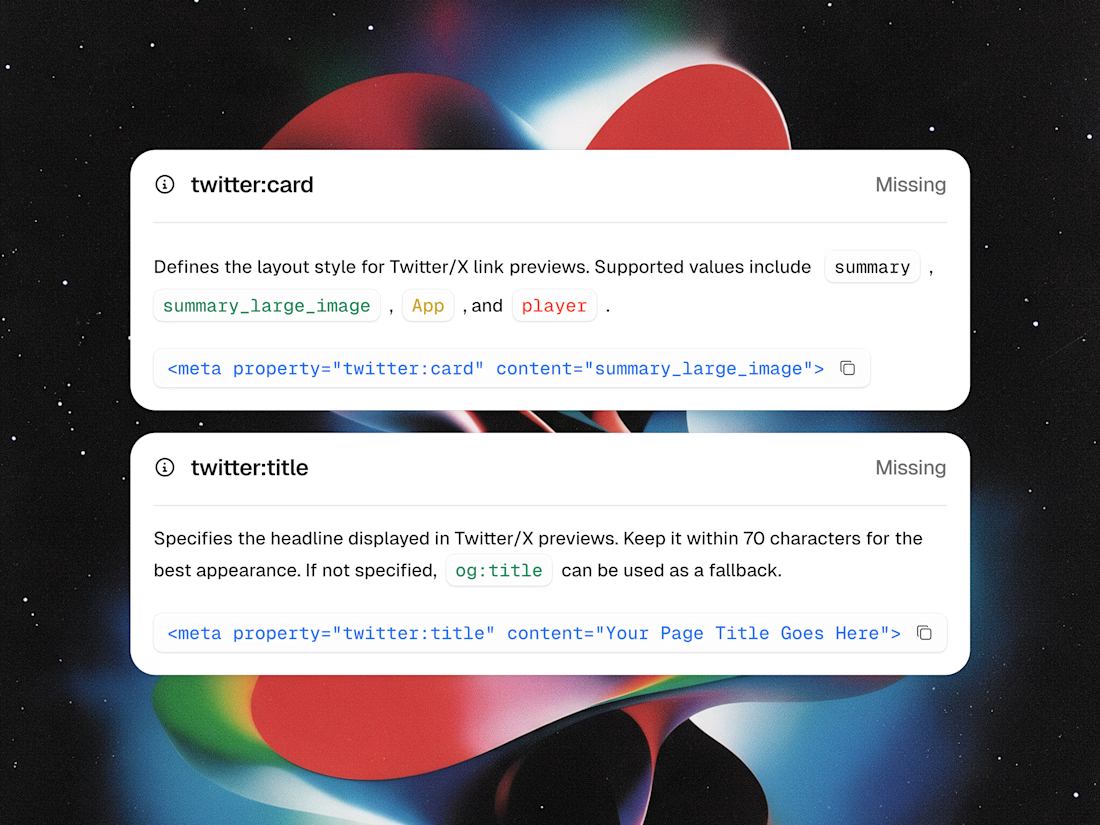
Shipping software shouldn't mean drowning in messy terminal logs or guessing if your link previews will work on social media. With CodeNest, we designed modular UI cards that turn complex deployment data and metadata debugging into an effortless visual experience.
Highlights of the UI snippet components:
• Deployment Details: Live tracking for production status, author attribution, 18-second build times, and commit logs.
• Social Card Debugger: Automated detection for missing twitter:card and twitter:title tags with copyable code snippets.
• Clean Data Architecture: High-contrast tags, monospaced code blocks, and single-click copy shortcuts.
Take a look at the attached snippet images to explore the layout and typography!
Would love to hear your thoughts in the comments! 👇


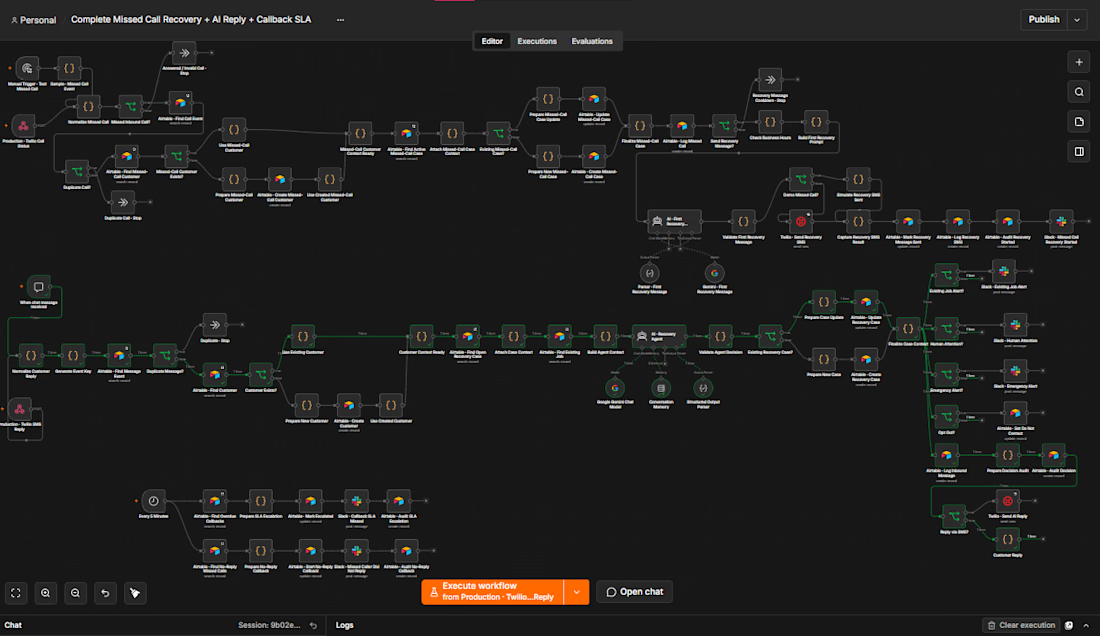
Built an n8n automation that recovers missed customer calls, starts an AI conversation, checks CRM context, routes urgent requests, and tracks callback SLAs until the customer is handled.



nice that it tracks the callback until someone actually handles it. which businesses is this built for, trades or more like clinics

The Let's Encrypt 429 lockout: Why automatic ACME issuance in ephemeral testing environments paralyzes releases and how centralized storage prevents outages.
Modern web servers like Caddy have revolutionized HTTPS by enabling automatic, zero-configuration TLS certificate issuance through Let's Encrypt and ZeroSSL. You point a domain name to your server, start the daemon, and within seconds, production-grade TLS 1.3 certificates are provisioned and renewed automatically.
However, when engineering teams introduce automated ACME servers into dynamic CI/CD staging environments, ephemeral Kubernetes clusters, or multi-node container stacks, a catastrophic failure mode frequently occurs: **the Let's Encrypt rate limit lockout**.
1. The Ephemeral Container Trap: In ephemeral staging or testing clusters, containers spin up and tear down constantly. If certificate storage is not persistently mounted to disk, every newly spawned container requests fresh certificates from Let's Encrypt production endpoints upon startup. 2. The 5-Certificate-per-Week Ceiling: Let's Encrypt enforces strict production rate limits: a maximum of 5 duplicate certificates per exact domain per week, and 50 new certificates per registered domain per week. Once exceeded, Let's Encrypt returns HTTP 429: ``too many certificates already issued for exact set of domains``. 3. Blocked Production Deployments: The rate limit cannot be manually reset or cleared by support tickets. Your domain is locked out for an entire 7-day rolling window. If this happens to a production domain or wild-card sub-domain during a scheduled release, the deployment halts completely.
Hardened enterprise TLS architecture isolates staging environments and centralizes certificate storage: • Use the Let's Encrypt Staging Environment for Testing: Configure test environments, PR preview apps, and staging clusters to point explicitly to the ACME staging endpoint (in Caddy: ``acme_ca https://acme-staging-v02.api.letsencrypt.org/directory``). Staging endpoints enforce massively higher rate limits, allowing unlimited test deployments without consuming production quotas. • Shared Storage Backends for Clustered Ingress: In multi-node proxy deployments, never allow individual instances to request certificates independently. Configure shared storage modules (e.g., PostgreSQL, Redis, or S3 storage plugins) so that all proxy instances share a single authoritative certificate cache and distributed mutex lock. • Implement Internal Enterprise CA for Staging: For non-public internal domains and staging environments, bypass public ACME entirely. Issue certificates using an internal FreeIPA or step-ca Private PKI, eliminating third-party rate limits and external dependency risks. • Graceful Fallback Strategies: Ensure ingress proxies maintain valid fallback certificates and cache existing valid keys on disk before attempting renewal.
Eliminate TLS lockout risks and guarantee seamless, automated certificate lifecycles across all environments.
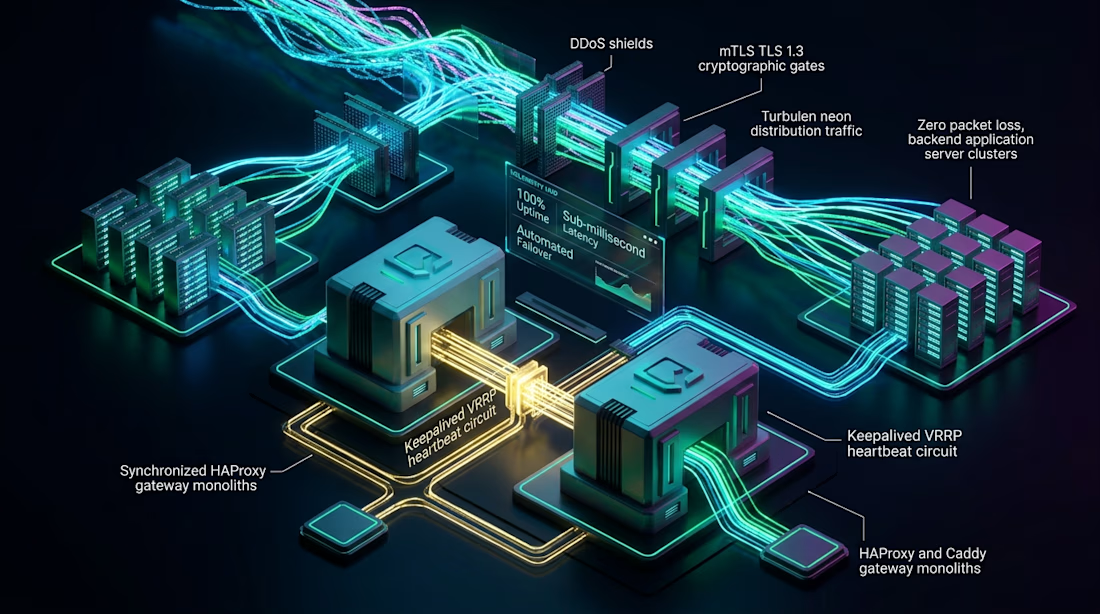
Deploy hardened, high-availability ingress with our 1-week High-Availability Ingress & Hardened Reverse Proxies Sprint on Contra: https://contra.com/s/Ec6sEAUW-high-availability-ingress-and-hardened-reverse-proxies-ha-proxy-and-caddy
#Security #Infrastructure #DevOps #Architecture #SRE #Networking #Cloud