The network for creativity
Join 1.25M professional creatives like you
Connect with clients, get discovered, and run your business 100% commission-free
Creatives on Contra have earned over $150M and we are just getting started
Back to feedPost

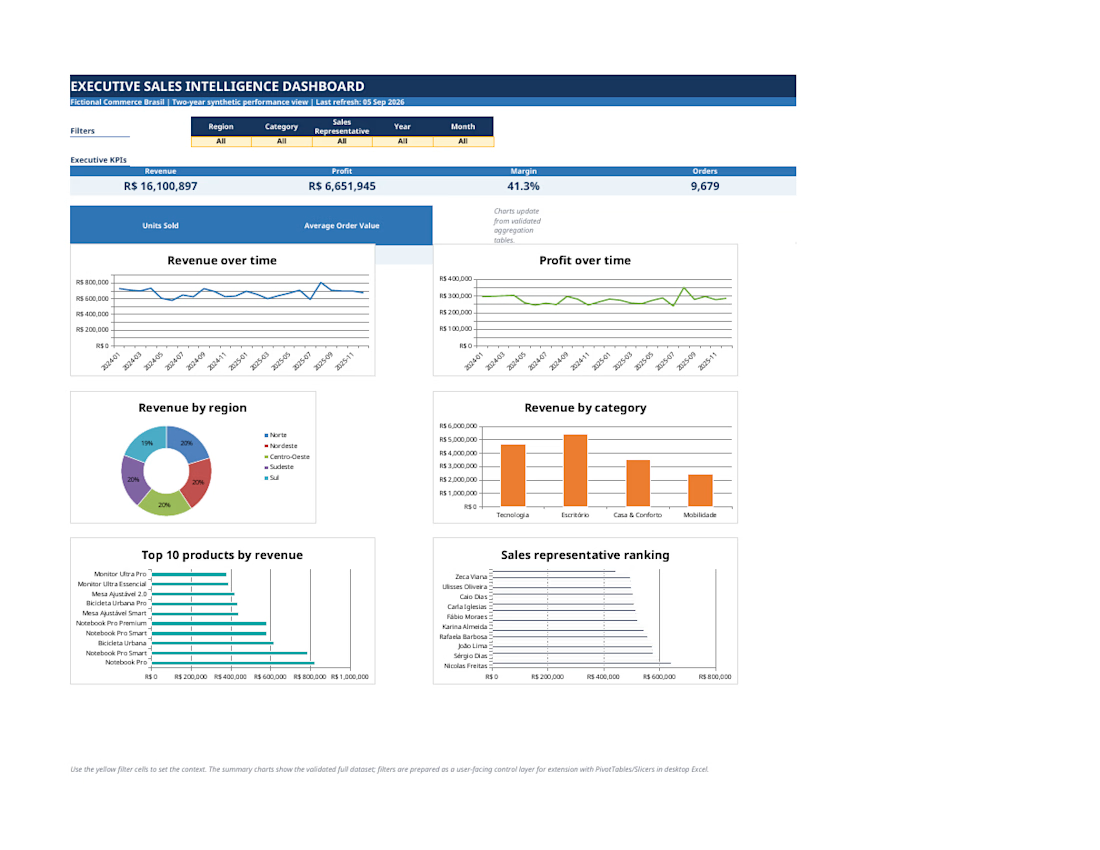
Excel Sales Intelligence Dashboard
Built a professional Excel dashboard that transforms 10,000+ sales records into actionable business insights through KPIs, interactive analysis, data visualization, and data quality validation.

The network for creativity
Join 1.25M professional creatives like you
Connect with clients, get discovered, and run your business 100% commission-free
Creatives on Contra have earned over $150M and we are just getting started








Related posts

What are your thoughts on the ongoing Power BI conversation?
In the meantime, lets have a look at this Marketing Analytics Dashboard.


Amazon Search & Pricing Audit for consumer electronics & smart hardware brand




Working with AI startups usually comes down to solving one major visual problem.
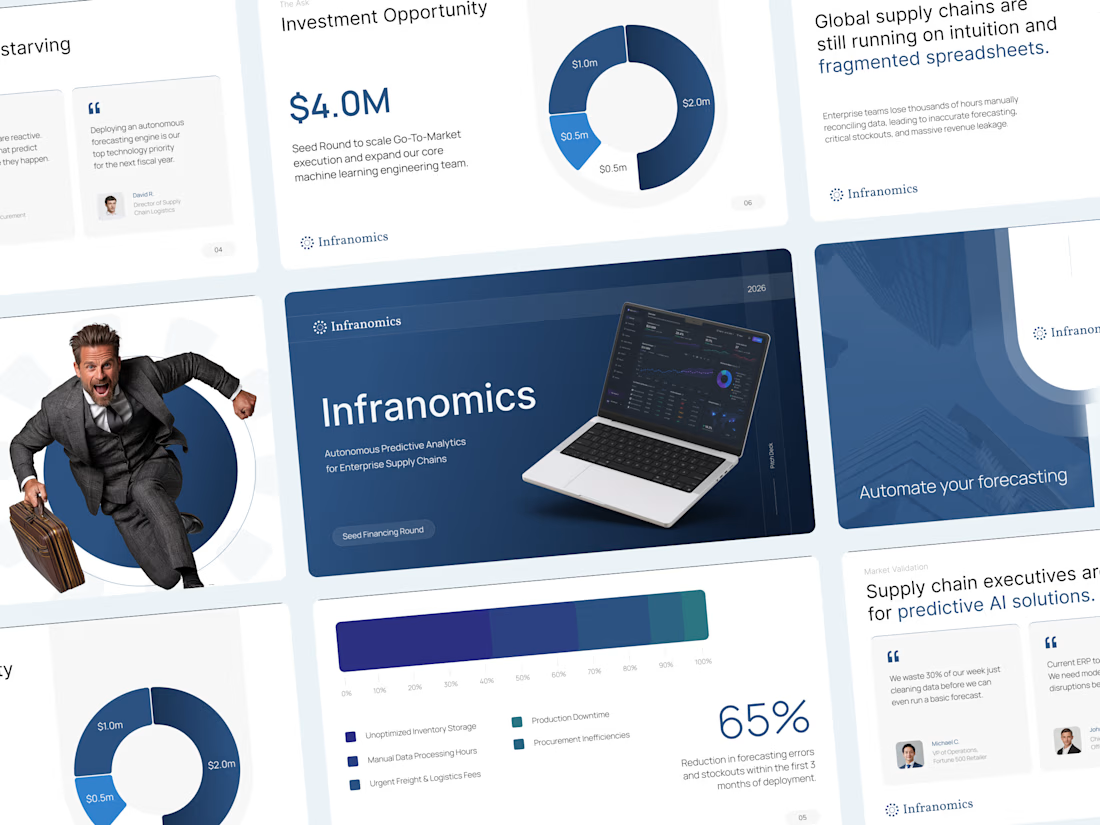
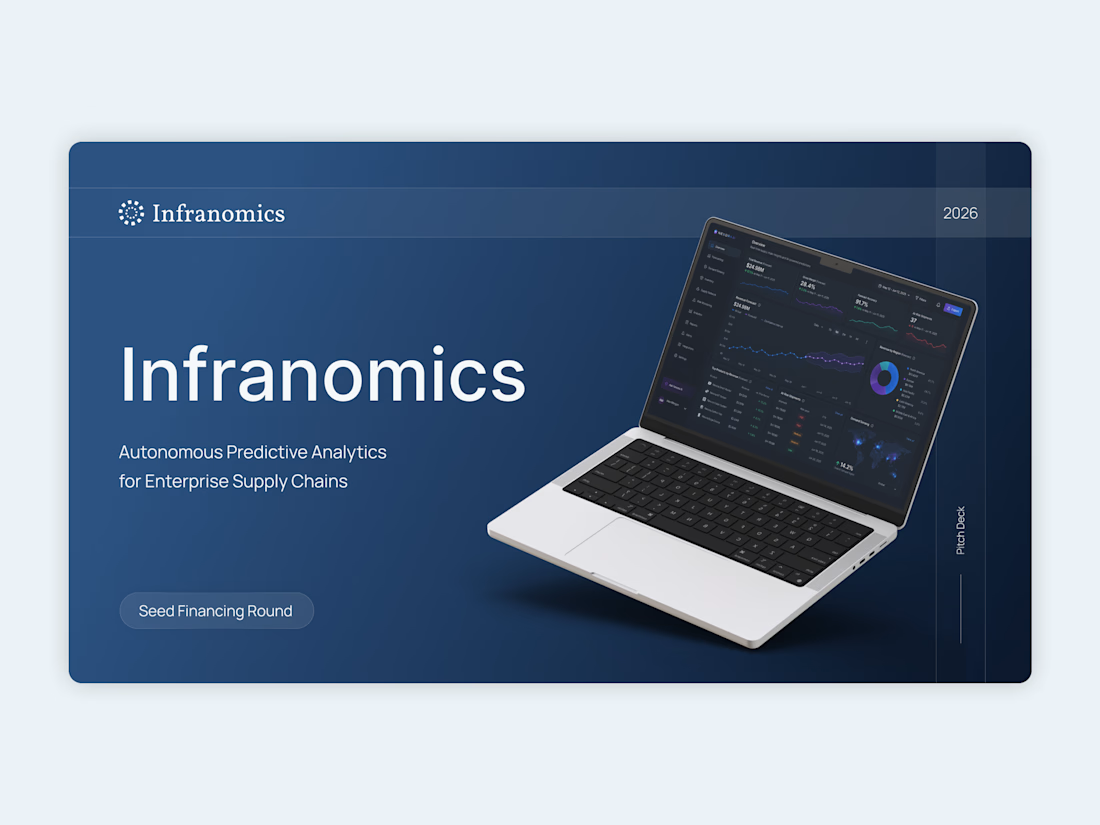
For this Infranomics project, the founders had built an incredibly powerful machine learning tool for supply chain analytics. The challenge was that their original materials looked like a dense technical manual rather than a compelling business narrative for venture capital funds. We needed to translate that heavy data into a clear and persuasive story.
The solution was to cut the noise and focus on pure clarity.
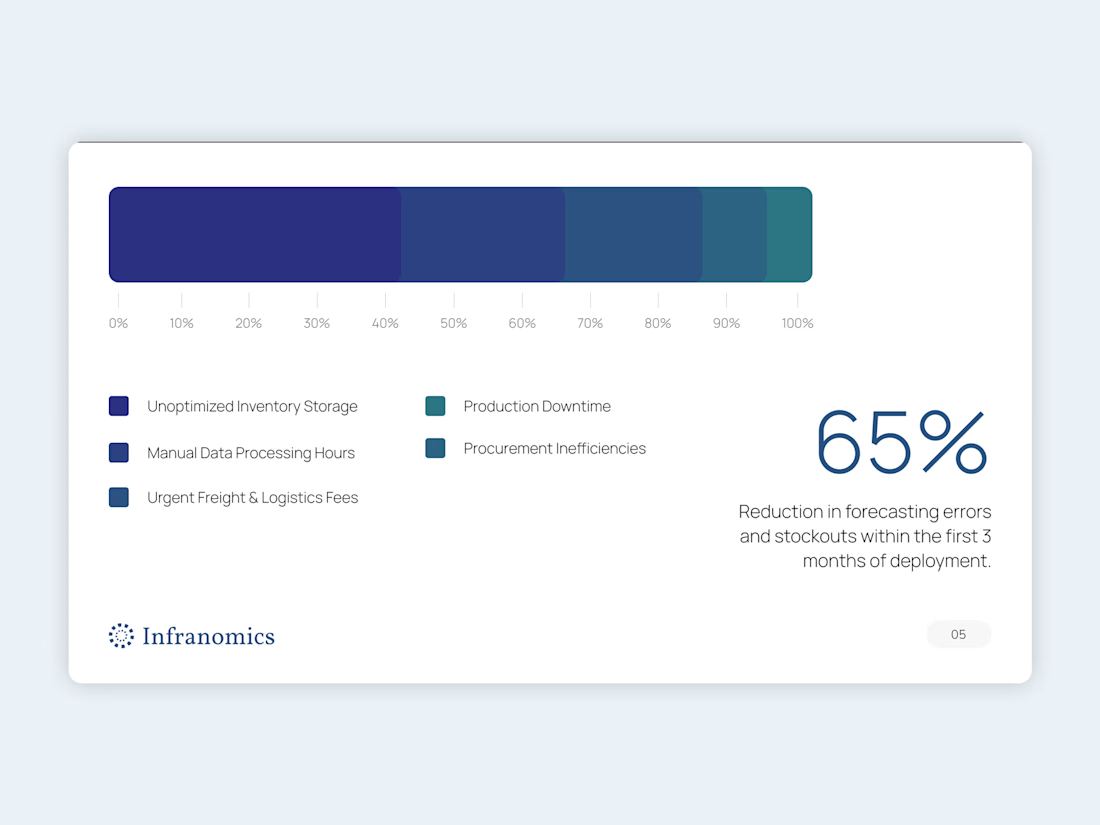
I moved the entire workflow into Figma to architect a highly customized design system from scratch. By using a minimalist aesthetic, clean typography, and very intentional custom data visualization, we managed to take their complex metrics and make them instantly understandable. Once the layouts were perfectly polished, everything was carefully rebuilt as a fully editable native PowerPoint file so the team could easily update numbers in the future.
The final result completely changed how their pitch was received.
Instead of forcing investors to suffer through cognitive overload and confusing charts, the new presentation gave the data room to breathe. It built institutional trust right from the first slide and ultimately helped the founders successfully secure their seed capital.
Sometimes the most advanced technology requires the simplest design.




Impressive work! 👏 Great example of turning complex AI data into a clear, compelling story that builds investor confidence.