The network for creativity
Join 1.25M professional creatives like you
Connect with clients, get discovered, and run your business 100% commission-free
Creatives on Contra have earned over $150M and we are just getting started
Back to feedPost
How The World Connects 🌍🎧
623 billion streams. 584 million podcast listeners. 1.8 billion video subscribers. These numbers are everywhere but nobody actually feels them.
So I built an interactive data sculpture for the #FigmaMakeathon that turns global media consumption into something you can touch, explore, and actually understand.
The Sculpture: Five concentric clay rings encoding real data from IFPI, Nielsen, and Statista. Click Hip-Hop and watch North America light up at midnight. Switch to Podcasts and see South Africa dominate at 66% weekly listening. Every connection reveals a story. 🎵🎙️🎬
Built with: Figma Make, 27+ iterations, cross-layer data highlighting, claymorphism, and way too much coffee ☕
Try it here!
https://ai-shrub-99836229.figma.site/
🔊 Click the rings


The Vision: A personal version where you connect your Spotify, your podcast app, your Netflix and generate YOUR own data sculpture. Like Spotify Wrapped but for your entire digital life. With real suggestions on how your media habits shape your daily routine. 🔮
Why it matters:...
The network for creativity
Join 1.25M professional creatives like you
Connect with clients, get discovered, and run your business 100% commission-free
Creatives on Contra have earned over $150M and we are just getting started
Related posts

I built a multiplayer embroidery sampler for the internet. It's called Common Thread.
It's the first thing I've ever vibecoded with Figma Make!
Try it here!
https://volt-harp-38332355.figma.site/
A sampler is a piece of fabric where you practice and collect different stitches — a reference guide and playground in one. They were meant to be passed between hands and added to over time.
Common Thread is that, but the fabric is infinite, the UI is whimsical, and the hands are anonymous.
Every visitor gets a patch on a shared canvas. You pick a thread color, choose a stitch type, and craft your art.
The part I love most: you can snap any section with a draggable embroidery hoop and export it, framed.
i love how Figma Make is a kind of tool that lets you focus on what something should feel like, not how to ship it. <3


this is wholsome!

Here's FigMold in action 👇
Your phone becomes a 3D sculpting controller. Scan a QR code, tilt to rotate, tap to switch brushes — then drop your sculpture into AR.
Best experienced on desktop or tablet. Open the link from my first post and try it yourself.
Built with Figma Make for the #FigmaMakeathon

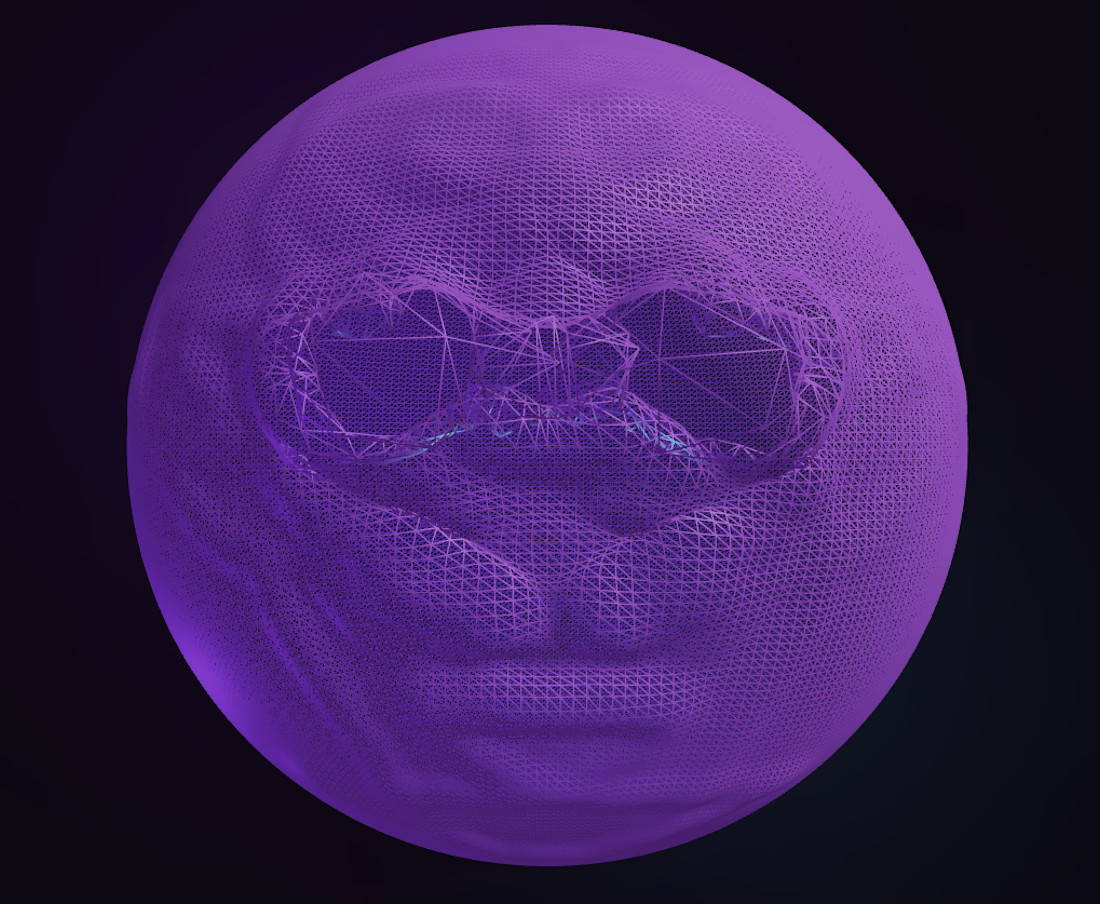
I do not know how to 3D mold and I just created the scariest thing in existence. Great job

Today I build Sound Flower 💐
A dreamy way to compose music through the art of floristry.
Every flower you pick is a unique instrument. Simply choose your favorite flowers, place them on the canvas, and play to listen to the one-of-a-kind melody you’ve created 🎶✨
Built for the #FigmaMakeathon with Figma Make
Try it now: https://soundflower.figma.site

This is such a beautiful concept blending music creation with floristry feels poetic and immersive. Love how creativity and interaction come together here


Trending
maxearnings
The next frontier of payments is live on Contra. How are you maximizing revenue?
freelancerlife
Freelancer life is wins, pivots, and everything in between. What’s yours right now?
aidesignflow
AI tools are redefining how designer work. What does your workflow look like?
micrographics
Micrographics started as utility - barcodes, packaging, instruction labels. How would you use them?
aivideo
AI video tools are moving at warp speed. What tools are you using?