The network for creativity
Join 1.25M professional creatives like you
Connect with clients, get discovered, and run your business 100% commission-free
Creatives on Contra have earned over $150M and we are just getting started
Back to feedPost

Spotify Data Analysis Dashboard | Power BI😊
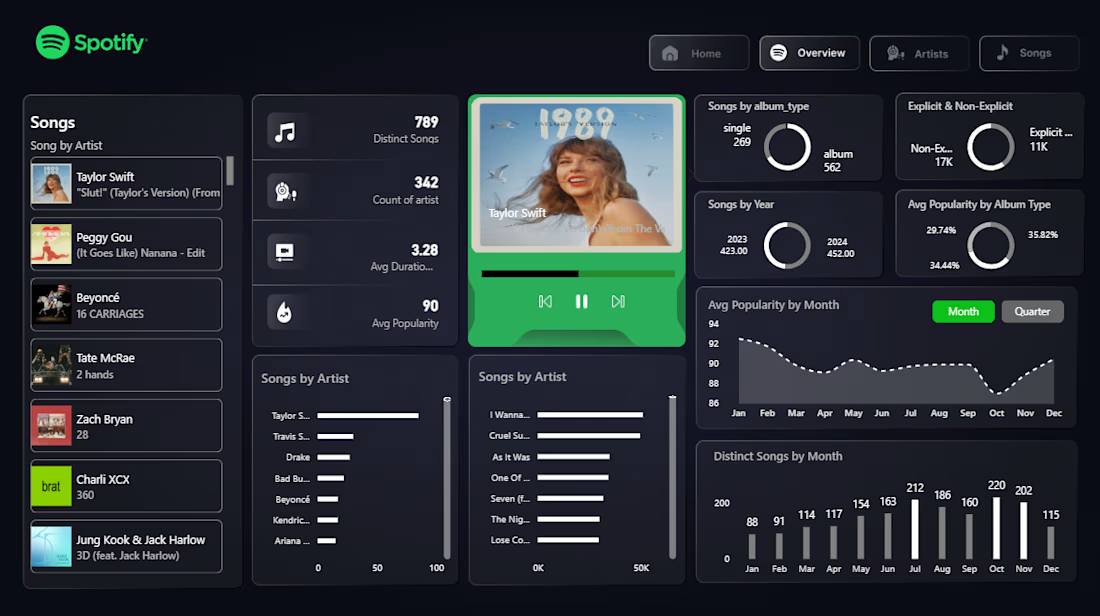
Developed an interactive Spotify analytics dashboard using Power BI to explore music streaming trends and analyze track performance. The dashboard presents key metrics and visual insights to help understand music popularity, listening trends, and track characteristics.
Tools Used: Power BI, DAX, Data Visualization, Data Analysis
Key Highlights:
Analyzed Spotify track data to identify popular songs and music trends.
Designed interactive visualizations to compare track performance.
Used KPI cards, charts, and slicers to make data exploration easier.
Organized the dashboard to present music-related insights in a clear, visually engaging format.
Project Objective: Transform Spotify music data into meaningful insights through interactive visual analytics.


The network for creativity
Join 1.25M professional creatives like you
Connect with clients, get discovered, and run your business 100% commission-free
Creatives on Contra have earned over $150M and we are just getting started






Related posts

Night Quota – a Halloween game about my hometown
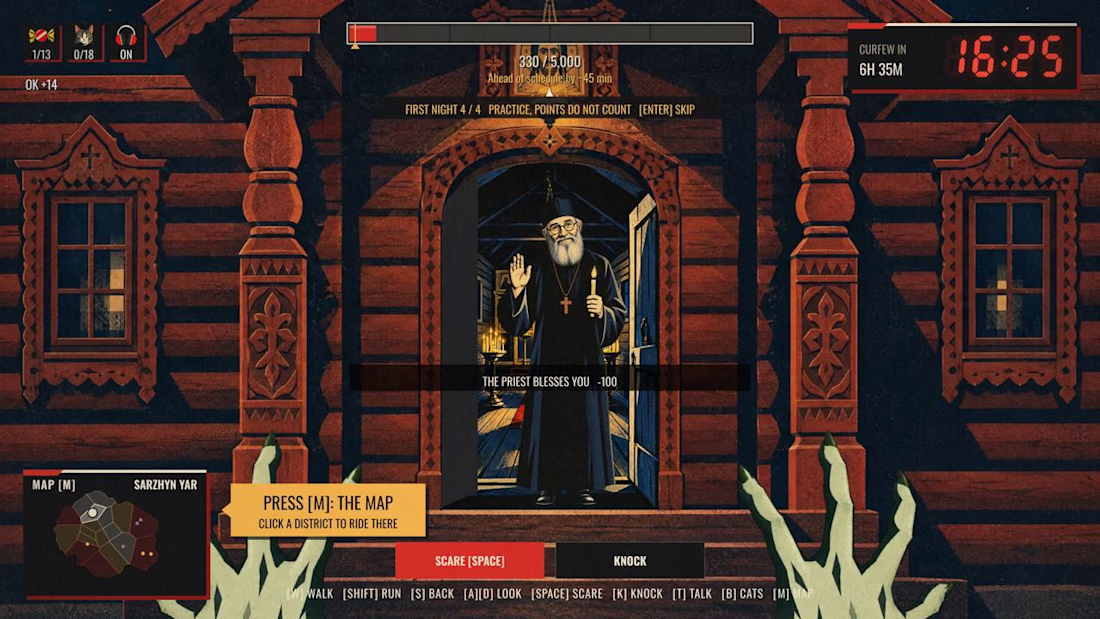
Monsters work one night a year. In Kharkiv, that night ends at 11 p.m. Not because of monsters. Because of the curfew.
Pick one of four monsters, walk the streets, scare people, knock on doors, and hit your quota before dawn. After eleven the streets empty and the job gets harder.
I’m from Kharkiv and I miss it, so I rebuilt it as a game. 18 districts, each started from my own photo of a real street and drawn as a constructivist poster, the style the city is known for. Every district has a local with a story about Kharkiv. The passers-by are people I love: my friends, my daughter as a little witch, and my cat Lisa, who hides in every district.
Features used: Rive CLI + GPU Canvas (both), Scripting, Data Binding, State Machines.
How it’s made
• Rive CLI + Claude Code: I’m a designer, not a game developer. I described the game, the agent wrote it, I watched the live preview and corrected it.
• RML for the scenes, Luau scripting for the logic: the night clock, the districts, the scares, the dialogues.
• GPU Canvas: one WGSL shader over the whole game. Curfew frame, searchlights, air-raid flash, a camera shutter for cat photos, the dawn report developing out of a halftone raster.
• Data Binding drives the HUD, State Machines run the buttons.
• Rive Editor to play it and check every screen.
• Higgsfield for character art, from my own references and photos.
Play it on desktop, with a keyboard and mouse.
Give it about 20 seconds to load, the whole city is in there.


The combination of clawed hands and the friendly priest is awesome! 😂🔥

Project Management Dashboard UI – A powerful and intuitive interface designed to enhance team collaboration, productivity, and workflow efficiency.


the yellow date card gives the eye a clear place to start, which most dashboards skip. how does the to-do list hold up when someone has 30 tasks instead of 5?

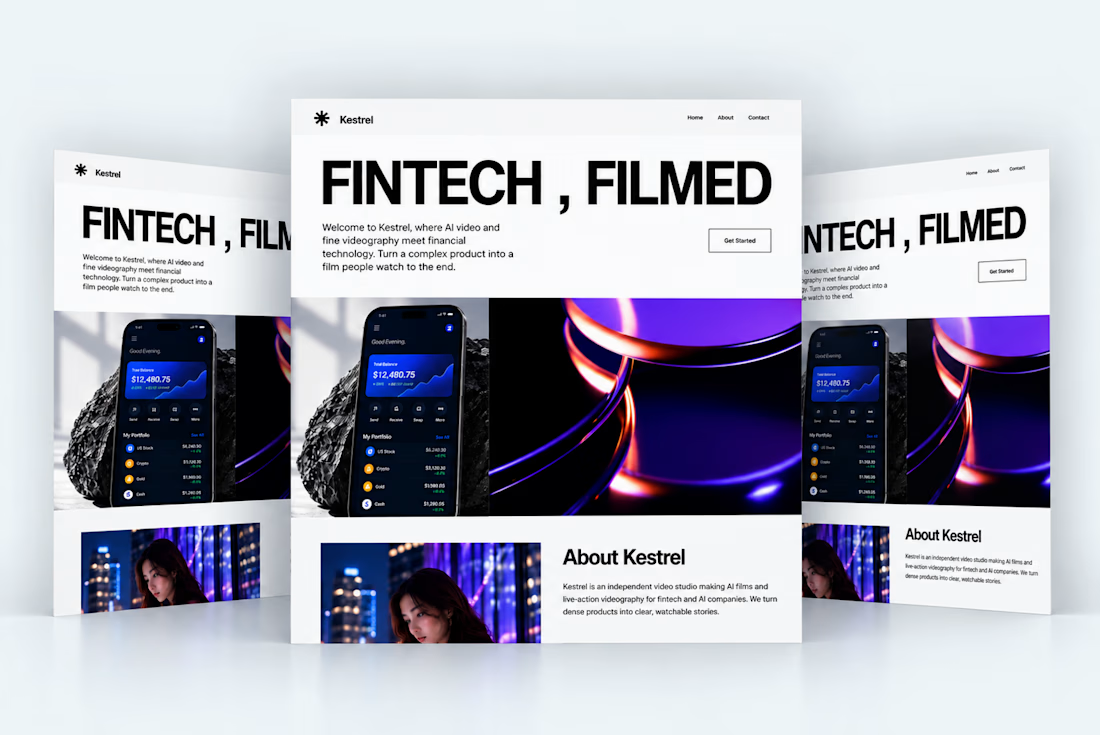
What if fintech didn’t just explain numbers, but made people feel the story behind them? 🎬
Meet Kestrel a concept exploring the intersection of AI filmmaking, visual storytelling, and financial technology.
Less complexity. More clarity. Stories worth watching.
Built with a cinematic visual direction in mind. ✦
What do you think of this direction?


Fintech often fails because users process data as cold numbers rather than personal narratives. Using AI to generate cinematic visuals can bridge that gap by making abstract financial concepts emotionally tangible and significantly easier to grasp.


