The network for creativity
Join 1.25M professional creatives like you
Connect with clients, get discovered, and run your business 100% commission-free
Creatives on Contra have earned over $150M and we are just getting started
Back to feedPost
Months become hours, on one chart.
The same Gantt chart, twice: the bars stretch across months, then collapse into hours as the product takes over. One chart, two timelines, no explanation needed.
Sound on. Full case study on my profile.


months to hours on a single gantt chart is a clean way to show it. the bars collapsing feels satisfying

Thanks Benjamin!
The network for creativity
Join 1.25M professional creatives like you
Connect with clients, get discovered, and run your business 100% commission-free
Creatives on Contra have earned over $150M and we are just getting started



Related posts


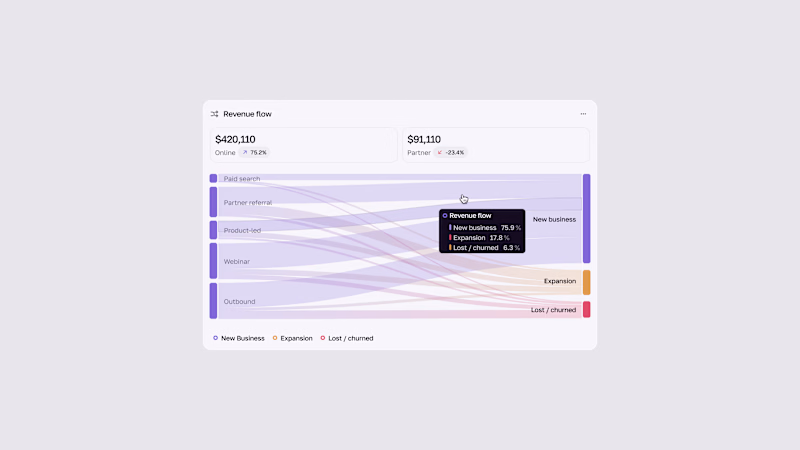
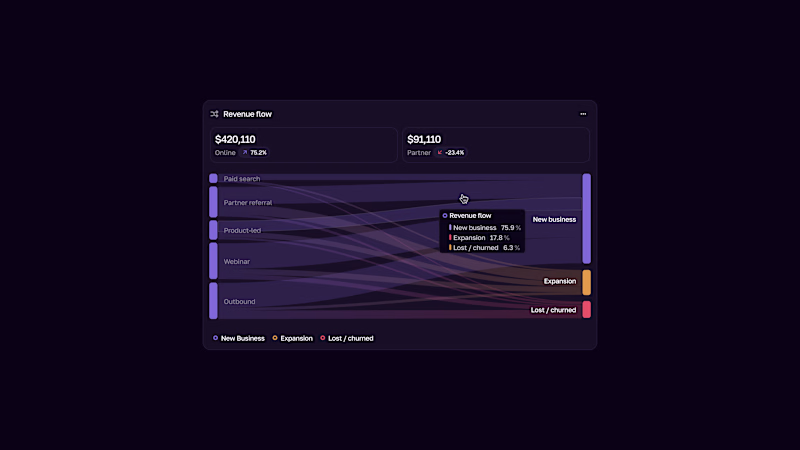


Looped animation made in @LottieFiles Creator playing with depth bold/simple shapes and text. 🪐
📂 Play with the original work here!

The blue was powerful
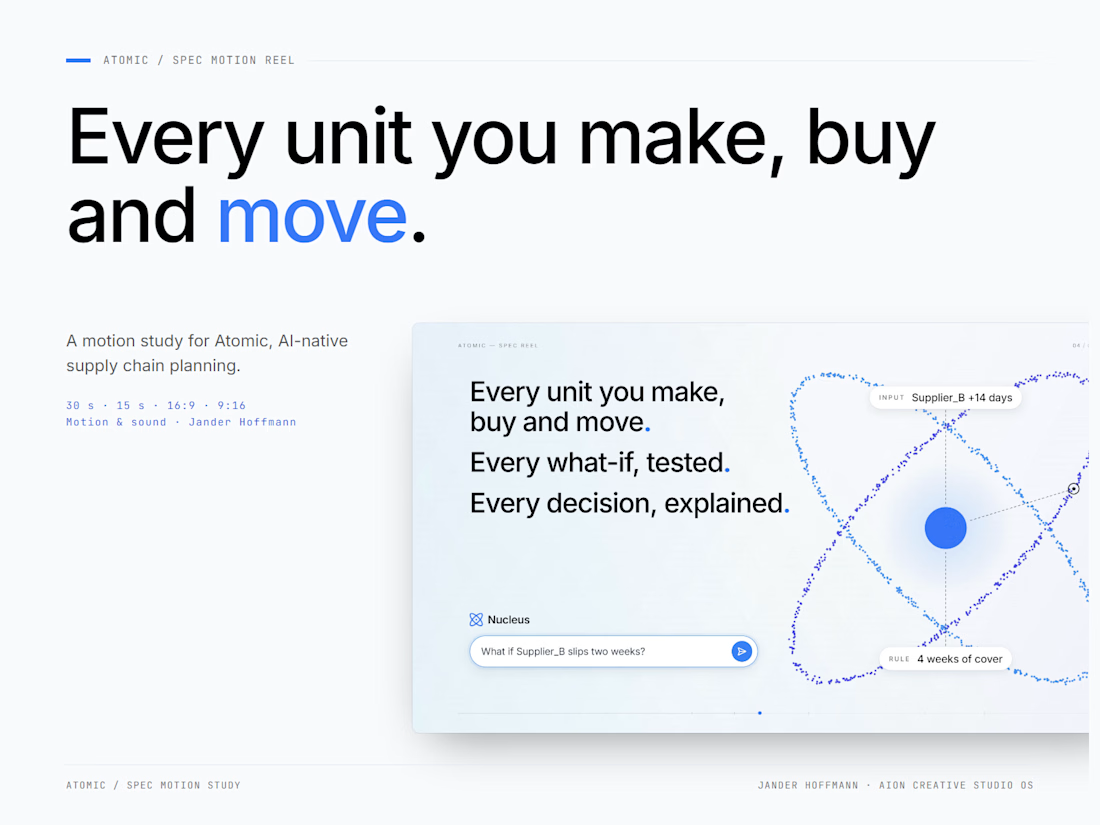
Atomic / Spec Supply Chain AI Reel
1,200 spreadsheet cells. One live model.
A motion study for Atomic, AI-native supply chain planning. It starts inside the spreadsheet a planner lives in, then every cell becomes a unit in one model that orbits like an atom.
15 and 30 seconds, landscape and native vertical, built in a code-based motion pipeline with original sound design. The full case study is on my profile.
Creative direction, motion & sound: Jander Hoffmann · Method: AION Creative Studio OS
Spec work - not affiliated with Atomic.

great