The network for creativity
Join 1.25M professional creatives like you
Connect with clients, get discovered, and run your business 100% commission-free
Creatives on Contra have earned over $150M and we are just getting started
Back to feedPost
Taste Test

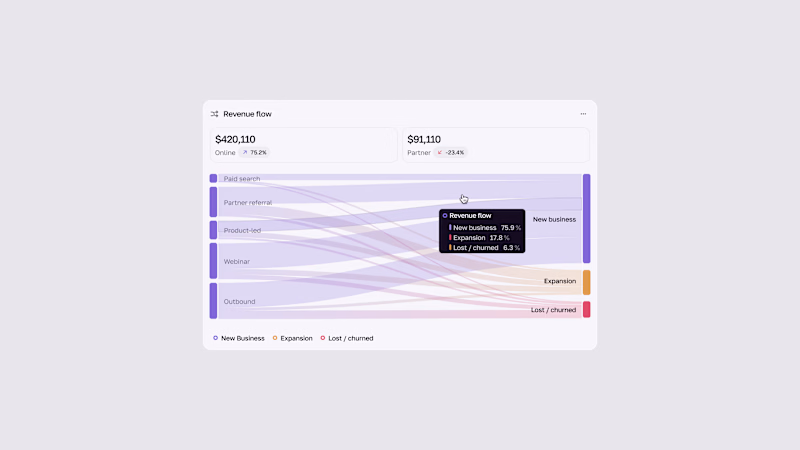
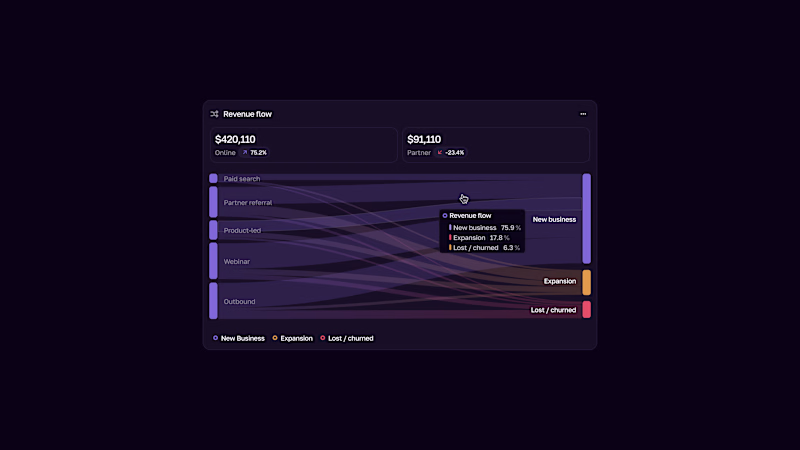

Light mode for me! ✨ Clean and easier to read the revenue flow.
But dark mode looks premium too - both versions are super clean, great work!

Thanks, Sagar! Really appreciate it! I’m still exploring both styles, so it’s great to hear different perspectives 🙌
Anytime Ahmad! Love seeing your explorations, keep it up! 🚀✨
Thank you so much🙌

Light
Thank you🙌

Not 100% yet, I’m still exploring different styles and variations. I’ll definitely check how the thinner flows look in light mode. Good point, thanks for bringing it up!

The light and dark modes preserve the chart’s visual hierarchy.
Thank you🙌

Thank you for feedback🙌

Light mode takes the vote for data clarity. When hovering over a single source does the chart dim all other paths and highlight only that flow across to the outcomes.
Thanks! Yes, when hovering, the opacity of other elements decreases slightly, shifting the focus to the main information. Here, I have emphasized the visual aspect.

Dark for me, nice work
Thank you 🙌
The network for creativity
Join 1.25M professional creatives like you
Connect with clients, get discovered, and run your business 100% commission-free
Creatives on Contra have earned over $150M and we are just getting started



Related posts


wowwwww😍


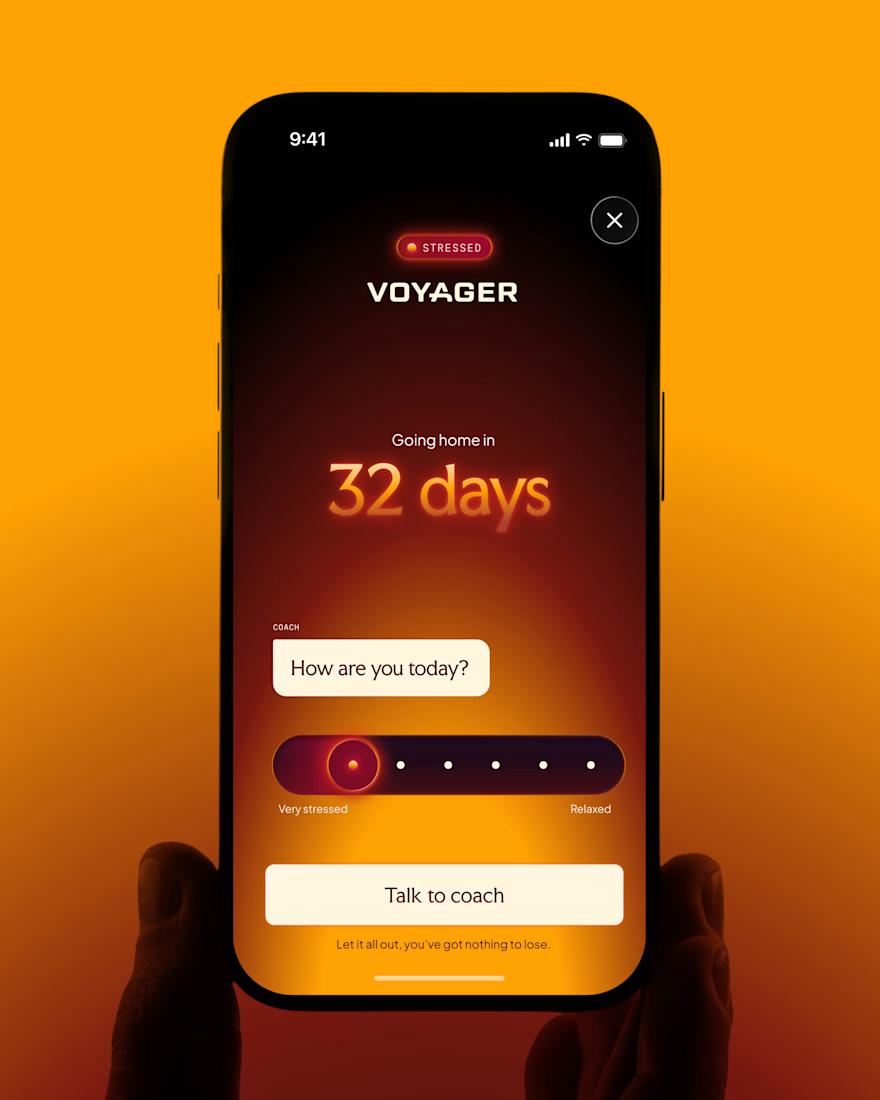
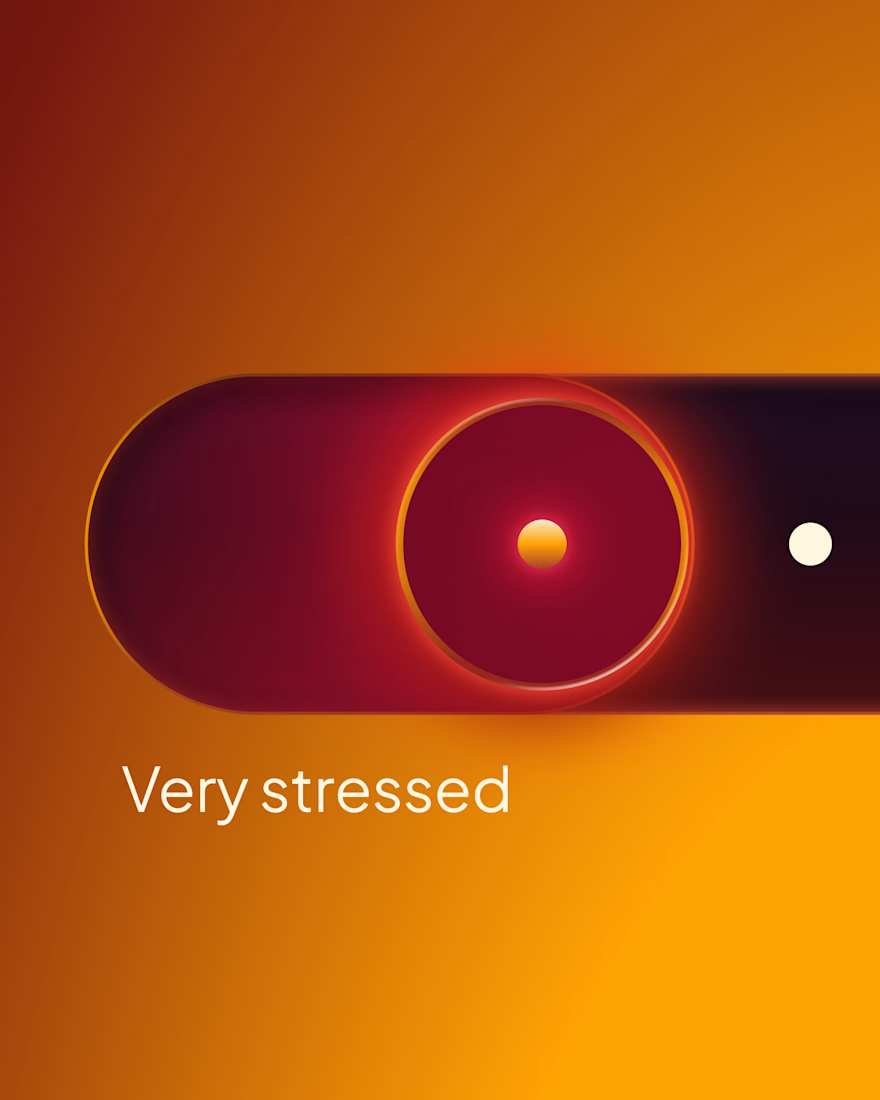

Yay! Experiences are now live for all Delphi users! Check them out live on https://delphi.ai/ Much more new features to come!
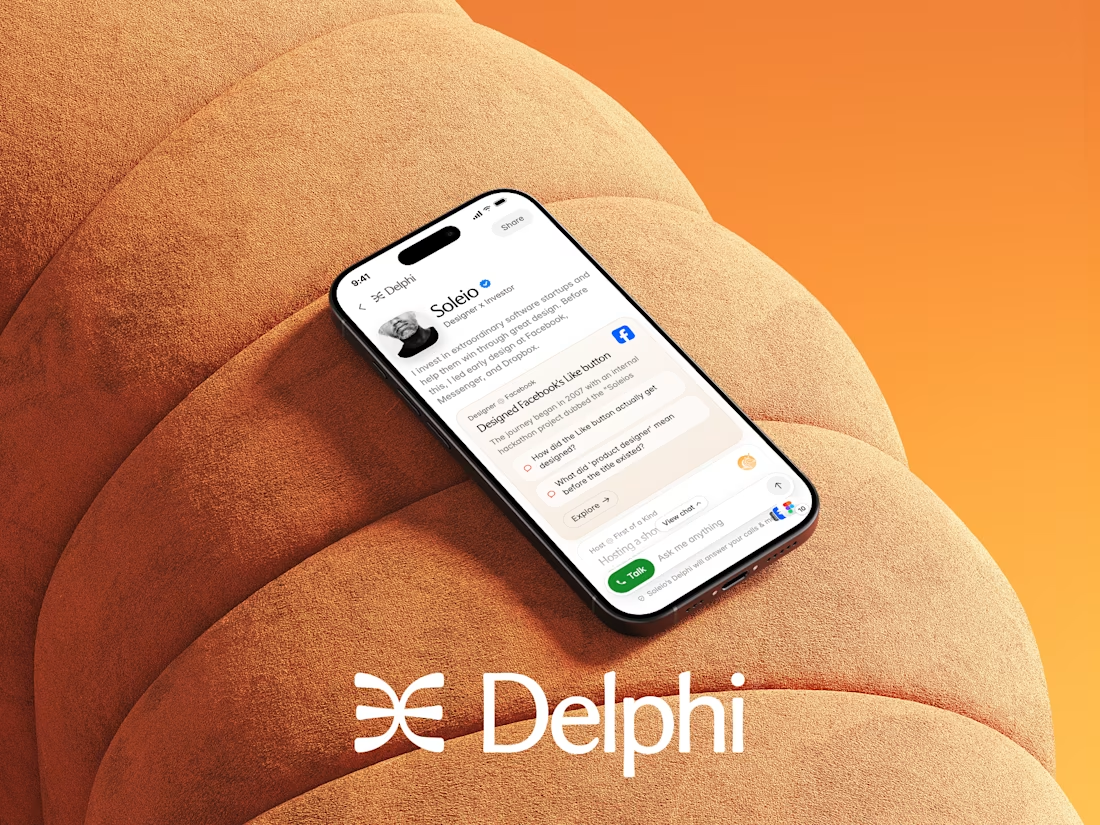

Congrats on shipping this Dario! Experiences sounds like a great addition to Delphi, curious to try it out