The network for creativity
Join 1.25M professional creatives like you
Connect with clients, get discovered, and run your business 100% commission-free
Creatives on Contra have earned over $150M and we are just getting started
Back to feedPost

HR Analytics & Attrition Dashboard (Advanced Excel)
I built a dynamic, interactive HR Analytics Dashboard entirely within Microsoft Excel to help people-operations teams track workforce health, monitor turnover trends, and improve employee retention strategy.
Key Features & Insights:
Core Workforce KPIs: Real-time visibility into Total Employees (1,470), Active Headcount (1,233), Attrition Volume (237), and an overall Attrition Ratio of 16.12%.
Sentiment Tracking: Built-in Job Satisfaction Rating indicator (2.6 score with visual star formatting) to monitor employee sentiment.
Attrition Breakdown Analysis: Comprehensive deep-dives looking into attrition by Education Level, Department (led by R&D and Sales), Age Group (highest in the 25–34 bracket), and Marital Status.
Demographics & Roles: Visual breakdown of employee gender distribution and role-specific turnover using conditional formatting and dynamic tree-maps.
Interactive Slicers: Added native Excel slicers for Education Field and Department, enabling seamless, one-click exploratory data analysis.


The network for creativity
Join 1.25M professional creatives like you
Connect with clients, get discovered, and run your business 100% commission-free
Creatives on Contra have earned over $150M and we are just getting started



Related posts

Crypto Portfolio Dashboard
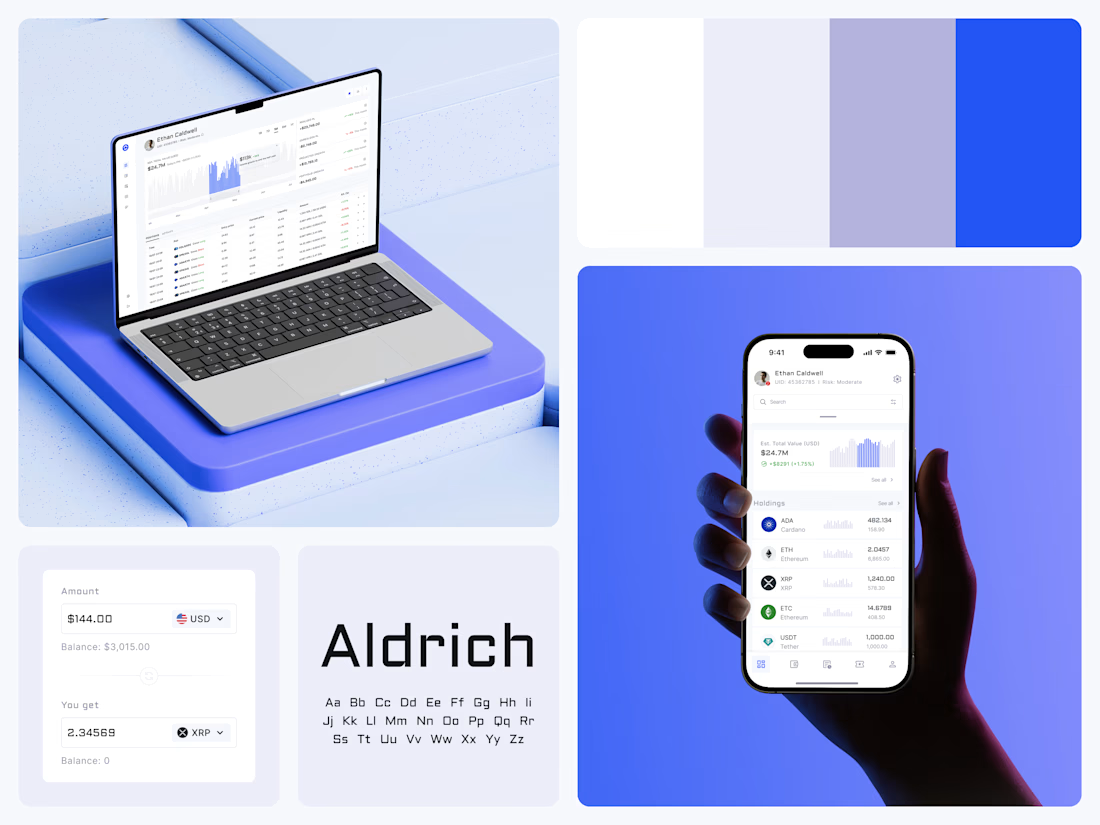
Blue means one thing here: the range you are looking at.
The value chart is a row of thin gray bars, and only the selected date range fills in blue. You read the period that matters and keep the months around it as context.
The phone carries the same chart above the holdings list. Each coin gets its own small bar chart between the name and the amount, so you can scan the whole portfolio for movement without opening a single coin.
Trading screens get busy fast. This one stays light and calm, so the numbers lead: total value, realized and unrealized P&L and open positions, all on one screen.
Designed by the Hue & Machine team.
#Crypto #Fintech #DashboardDesign #TradingPlatform #DataVisualization #UIDesign #ProductDesign #WebApp #MobileDesign #FigmaDesign



Nice Ui Dmytro


Amazing work

A swell chart that answers before you read the axis.
Lead with the number people came for, then let the chart back it up. Motion should guide the eye, not decorate.
