The network for creativity
Join 1.25M professional creatives like you
Connect with clients, get discovered, and run your business 100% commission-free
Creatives on Contra have earned over $150M and we are just getting started
Back to feedPost

I recently developed an interactive dashboard using Power BI to analyze IPL 2025 player performance. This project focuses on transforming raw cricket data into meaningful insights through visualization and analytics.
🔍 Key Highlights of the Dashboard:
• Player-wise analysis of Runs, Wickets, Strike Rate & Economy
• Identification of Top Batsmen and Bowlers
• Interactive filters (Search Player feature 🔍)
• Visualizations including Bar Charts, Pie Charts & Scatter Plots
• KPI Cards for quick insights
💡 This project helped me strengthen my skills in:
• Data Cleaning & Preparation using Excel
• Data Modeling & Visualization using Power BI
• Creating DAX Measures for analysis
• Designing interactive and user-friendly dashboards


The network for creativity
Join 1.25M professional creatives like you
Connect with clients, get discovered, and run your business 100% commission-free
Creatives on Contra have earned over $150M and we are just getting started





Related posts

Turn Your Data Into Clear, Useful Insights
Need help organizing messy data or creating professional reports?
I can help with:
. Data Entry & Data Cleaning
. Excel & Google Sheets
. PDF/Image to Excel
. Charts & Graphs
. Dashboards & Reports
. Pivot Tables & Summaries
. Online Data Collection & Research
Accurate data. Clean spreadsheets. Professional visualizations.
DM me to discuss your project or get started!


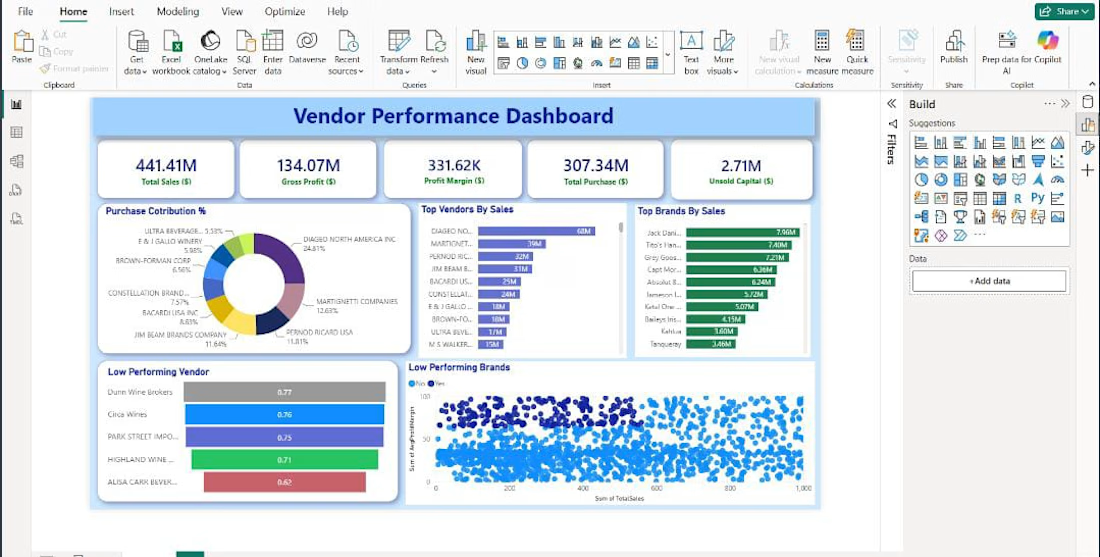
Created a Vendor Performance Dashboard using SQL, Python and Power BI to analyze sales, purchases, profitability, and vendor performance. Cleaned and analyzed the data and presented key insights through interactive visualizations.


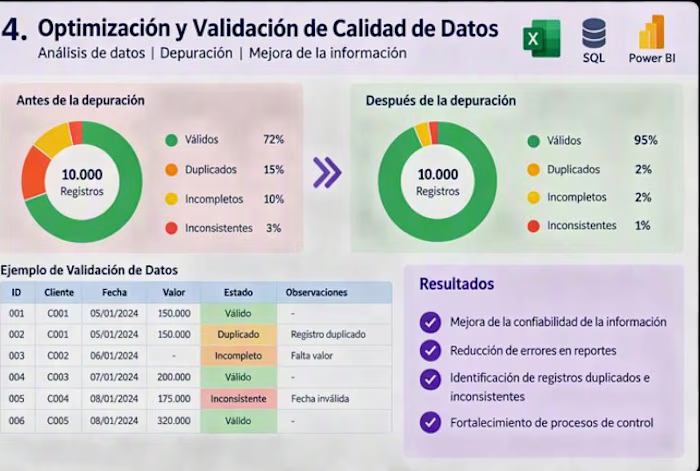
Título: Optimización y Validación de Calidad de Datos
Descripción: Implementé controles para evaluar la calidad de la información almacenada en bases de datos operativas, identificando registros incompletos, duplicados e inconsistentes.
Responsabilidades:
Análisis de calidad de datos.
Validación de registros.
Generación de alertas.
Elaboración de informes de hallazgos.
Herramientas utilizadas:
Excel
SQL
Power BI
Resultado:
Mejora de la confiabilidad de la información.
Reducción de errores en reportes.
Fortalecimiento de procesos de control