The network for creativity
Join 1.25M professional creatives like you
Connect with clients, get discovered, and run your business 100% commission-free
Creatives on Contra have earned over $150M and we are just getting started
Back to feedPost

Maped all settlements in Belarus mentioned in Wikipedia (Official Standard edition — be.wikipedia). Those that have an info about the date of foundation or first mention (only 6.5% in total, somewhat 1.5k out of 23k) also plotted on the timeline below.
Interestingly, the relative number of the settlements with the indicated date is much higher in the Homyel region (37%) — this is where the tireless editors of the Belarusian version come from, I guess.
You can play with the interactive version and explore all the collected lines by regions, centures, and settlement types: https://yanouski.com/work/graphing-belarus/settlements-origins/

The network for creativity
Join 1.25M professional creatives like you
Connect with clients, get discovered, and run your business 100% commission-free
Creatives on Contra have earned over $150M and we are just getting started











Related posts

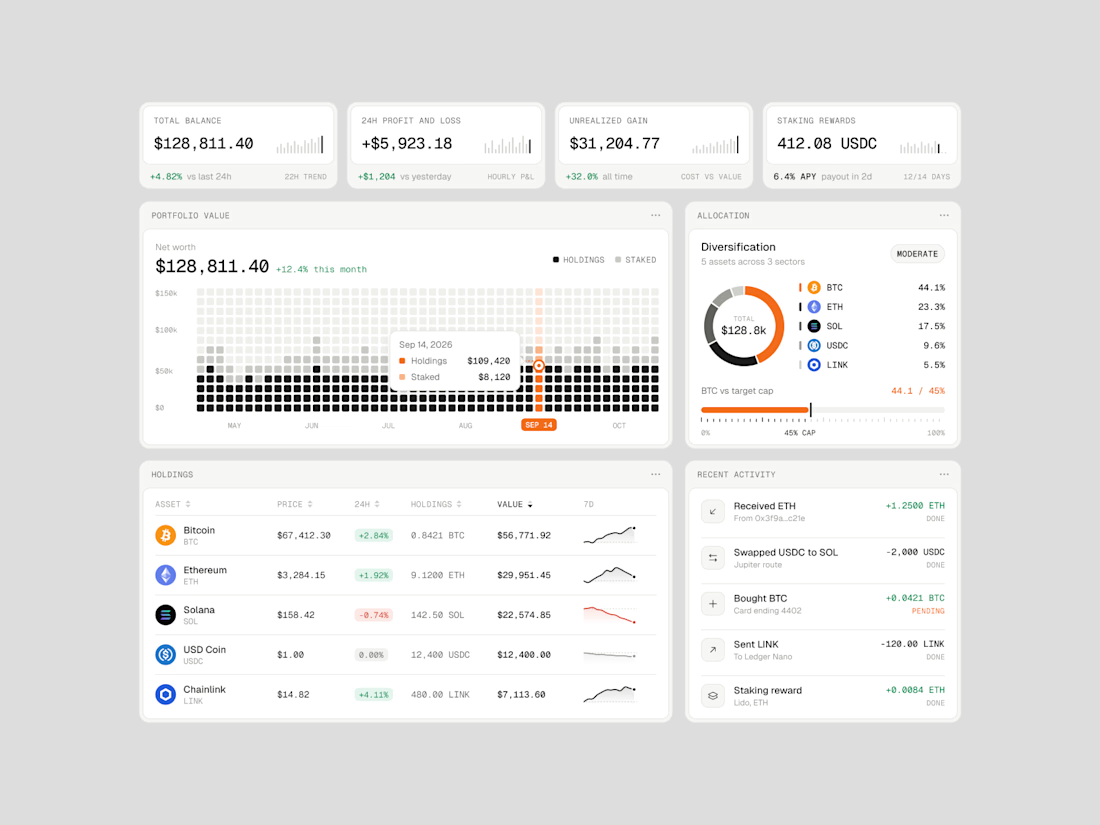
Exploring how complex financial data can feel simple, structured, and easy to navigate.
Vault One is a crypto portfolio dashboard concept that brings together asset performance, portfolio allocation, transaction history, and key financial metrics in one workspace.
I focused on visual hierarchy, information density, and data visualization, using a neutral color palette, subtle UI details, and selective accent colors to keep the interface clean without compromising functionality.
The goal was to make the data easier to understand, not just nicer to look at.
Would love to hear your thoughts on the visual direction and layout!
#ProductDesign #UIDesign #Fintech #DashboardDesign #UXDesign




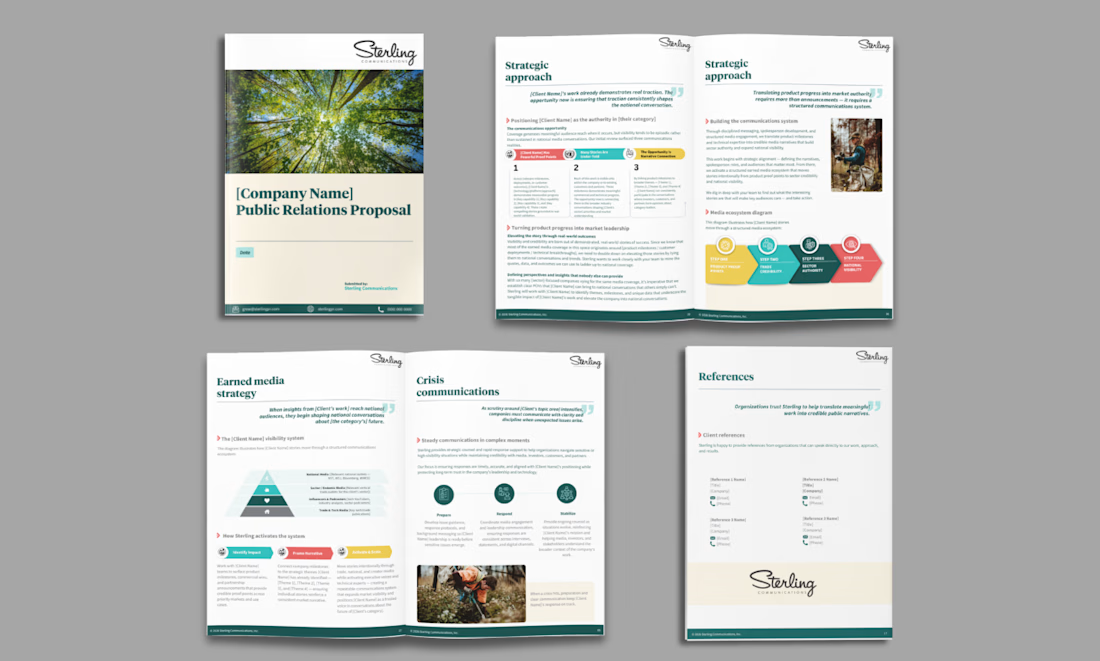
Designed a 30-page company proposal for a client, featuring a clean, professional layout, structured content, and polished visuals to present the company’s services and value proposition effectively.
Every page was designed with a focus on readability, visual consistency, and a professional corporate look.
Looking for a professional company proposal, corporate profile, or business presentation? Let’s bring your ideas to life!
#CompanyProposal #CorporateDesign #GraphicDesign #CanvaDesigner #BusinessProposal #CorporateProfile #DocumentDesign #PresentationDesign #CanvaDesign



The colorful diagrams break up the pages so nicely, Sheena

Imagining you book your flight while experiencing
Meet Contrail.
Complex data into beautiful visuals in 3d.
Demo: https://flights-gr8r.vercel.app


Booking a flight with a 3D plane in the search is a fun idea. The dark UI makes the model stand out well.