The network for creativity
Join 1.25M professional creatives like you
Connect with clients, get discovered, and run your business 100% commission-free
Creatives on Contra have earned over $150M and we are just getting started
Back to feedPost

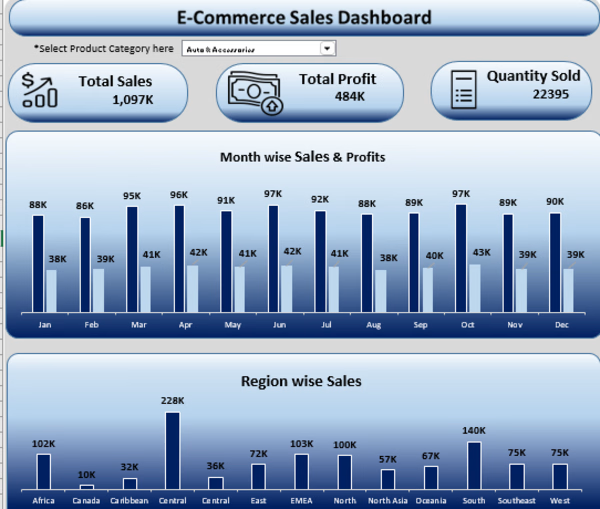
I created an interactive Excel dashboard to help businesses understand their sales and profitability. The project involved cleaning and organizing sales data, analyzing monthly sales and profit, comparing regional performance, and creating interactive charts and filters for product categories.
The dashboard turns raw sales data into clear visual insights that can help business owners monitor performance and make data-driven decisions.
Tools: Microsoft Excel, Pivot Tables, Charts, Data Cleaning, Dashboard & Data Analysis

The network for creativity
Join 1.25M professional creatives like you
Connect with clients, get discovered, and run your business 100% commission-free
Creatives on Contra have earned over $150M and we are just getting started





Related posts

One quarterly number almost got double-counted across two reports.
Two dashboards were quietly tracking overlapping data. Caught before it went out now there's one source of truth the reports pull from, not two that can disagree.
→ A good number is only as good as the one place it actually comes from



Great catch before it shipped. I like the “one source of truth” framing - pulling reports from one validated source makes it much harder for a duplicate dashboard to quietly skew the number again.

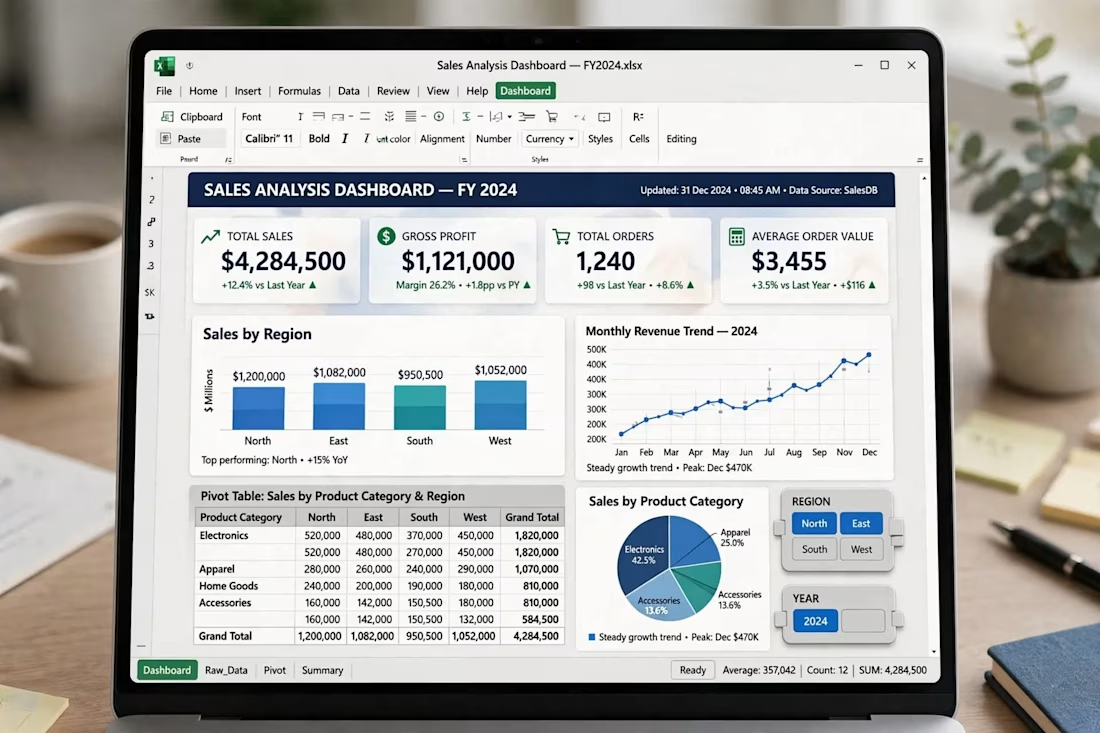
I built an advanced Sales Analysis Dashboard in Microsoft Excel for FY 2024. Features include total sales tracking, pivot tables, monthly revenue trends, and product category analysis. I turn raw data into clear business insights using Excel.

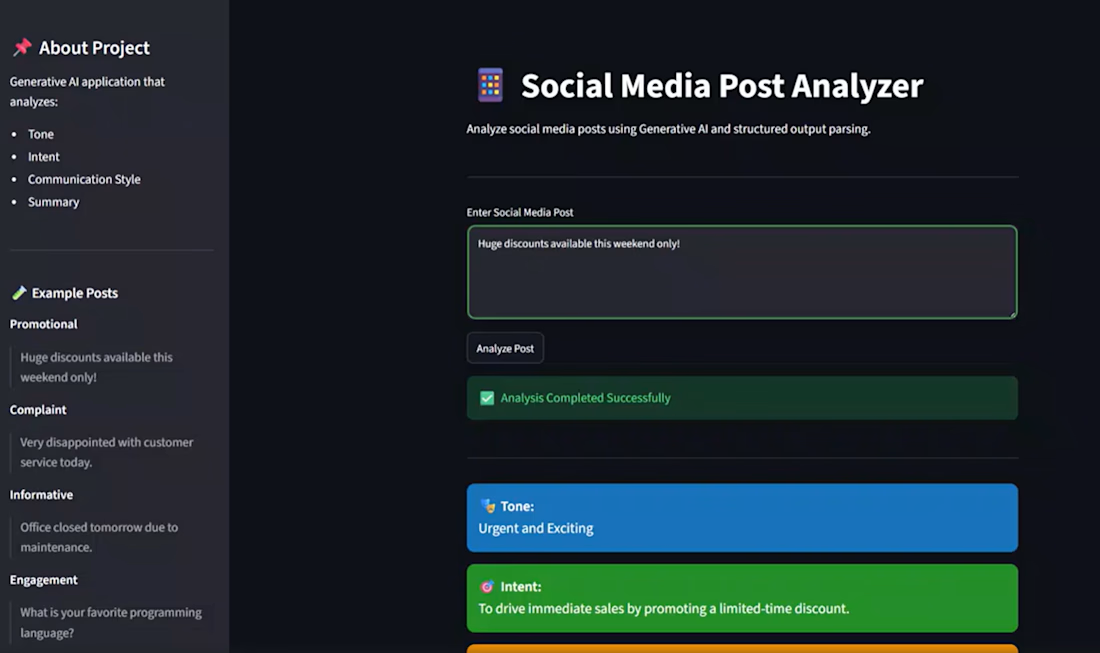
Built an AI-powered Social Media Post Analyzer that analyzes social media content and generates structured insights using LLMs.
The application uses LangChain and Pydantic to process the input and return structured results through an interactive Streamlit interface.
Built with: Python, LangChain, Pydantic, Hugging Face, Streamlit, and LangSmith.



Pydantic catches shape errors, but a plausible wrong insight can still pass. I'd keep a small set of posts with expected labels in LangSmith and rerun it after prompt changes. Are you tracking that kind of drift?