The network for creativity
Join 1.25M professional creatives like you
Connect with clients, get discovered, and run your business 100% commission-free
Creatives on Contra have earned over $150M and we are just getting started
Back to feedPost

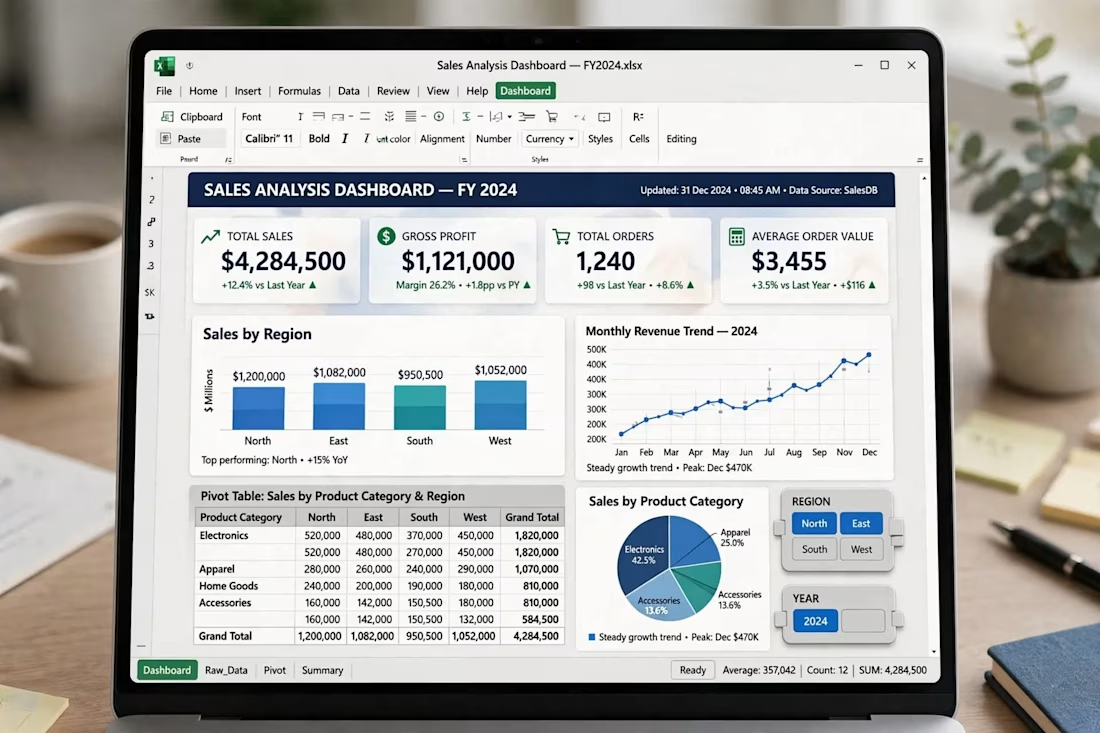
I built an advanced Sales Analysis Dashboard in Microsoft Excel for FY 2024. Features include total sales tracking, pivot tables, monthly revenue trends, and product category analysis. I turn raw data into clear business insights using Excel.

The network for creativity
Join 1.25M professional creatives like you
Connect with clients, get discovered, and run your business 100% commission-free
Creatives on Contra have earned over $150M and we are just getting started





Related posts

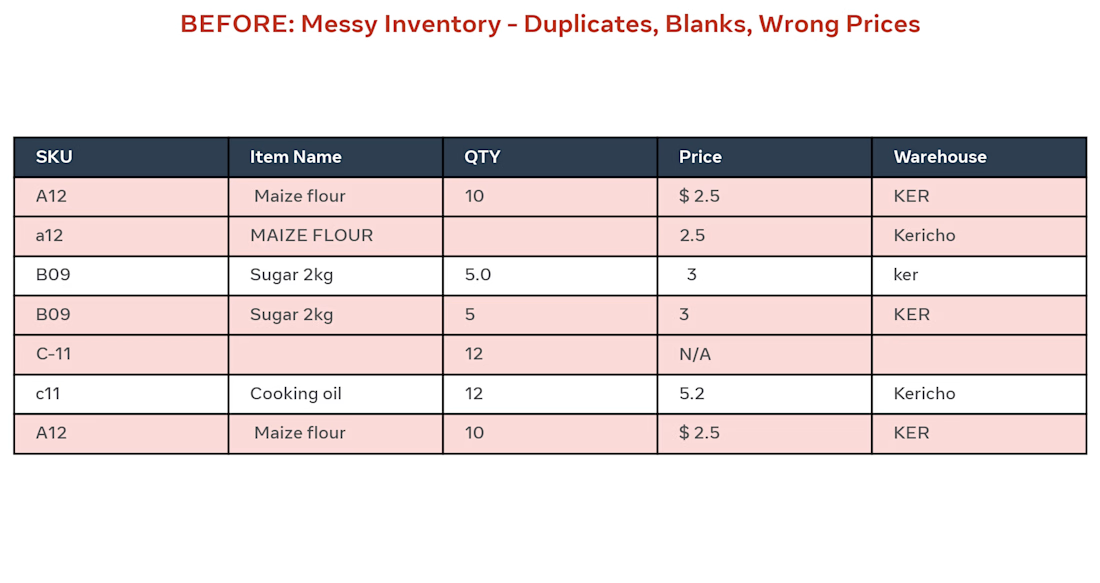
BEFORE: Client had messy Excel inventory with 500 rows, duplicates (A12 / a12), blanks, wrong prices like "$ 2.5" and "N/A", and different warehouse names (KER / ker / Kericho).
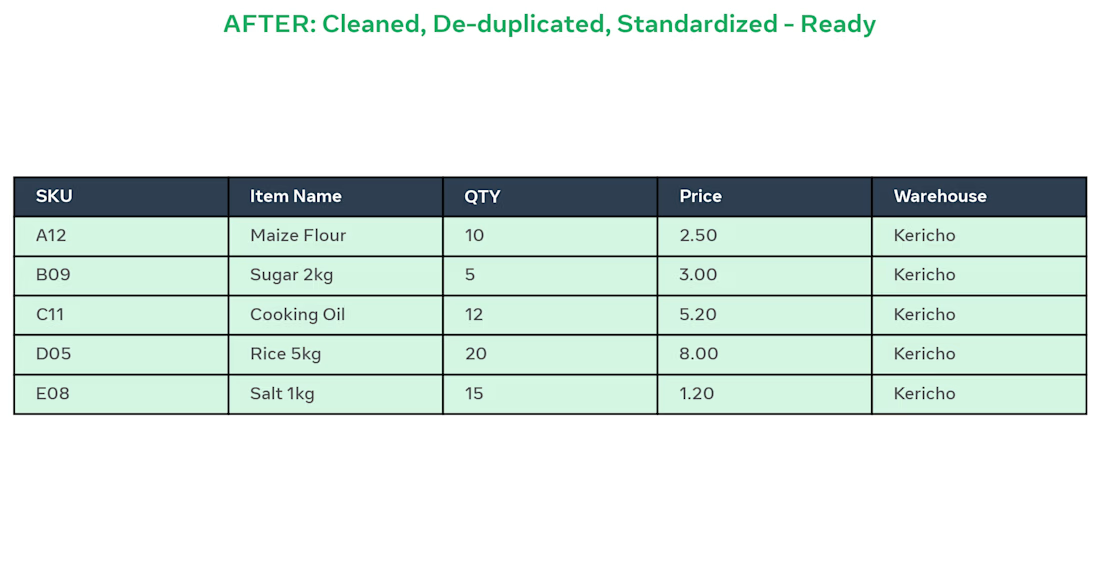
AFTER: I did:
Removed 12 duplicate SKUs
Standardized item names to Title Case
Fixed QTY and Prices to 2 decimals
Unified Warehouse to Kericho
Made sheet ready for pivot dashboard
Result: Clean, ready-to-use inventory in 2 days using Excel.
Tools: Excel, Remove Duplicates, Text to Columns, TRIM, PROPER

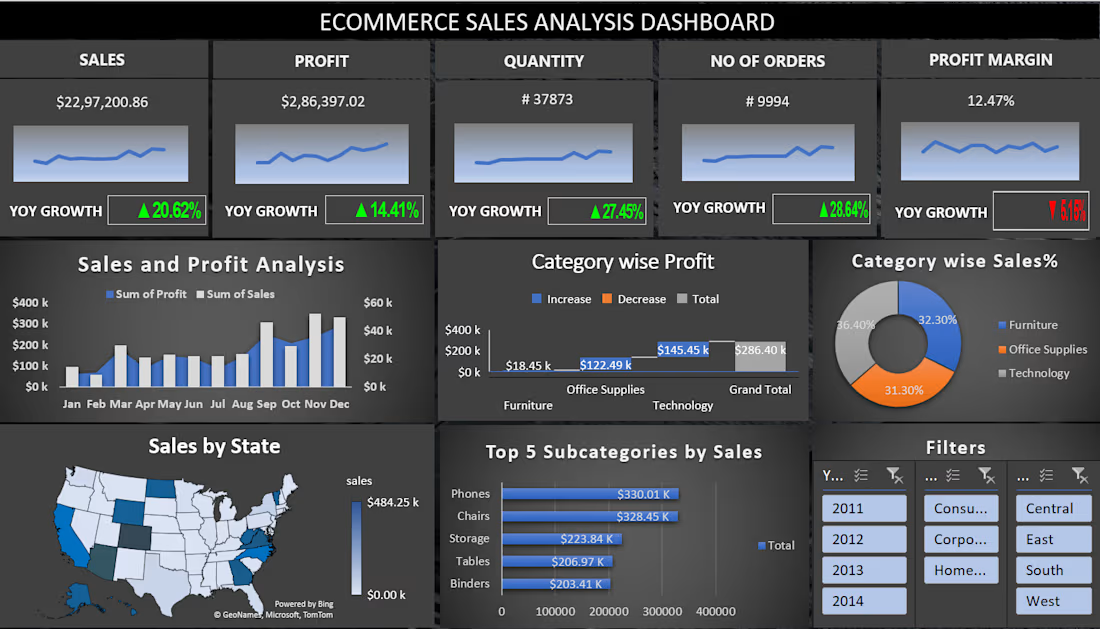
E-Commerce Sales Analysis Dashboard — Excel

I designed and engineered this interactive astronomical almanac for Ephemeris.
Blending nineteenth century celestial cartography with responsive data visualization required coordinating intricate astronomical calculations with period print typography. Programming a rotatable calendar dial that recalculates the night sky in real time, projecting accurate planetary alignments and lunar phases alongside a cataloged archive spanning 174 historical editions, turned complex ephemeris tables into an engaging visual experience.😊 👍


