The network for creativity
Join 1.25M professional creatives like you
Connect with clients, get discovered, and run your business 100% commission-free
Creatives on Contra have earned over $150M and we are just getting started
Back to feedPost
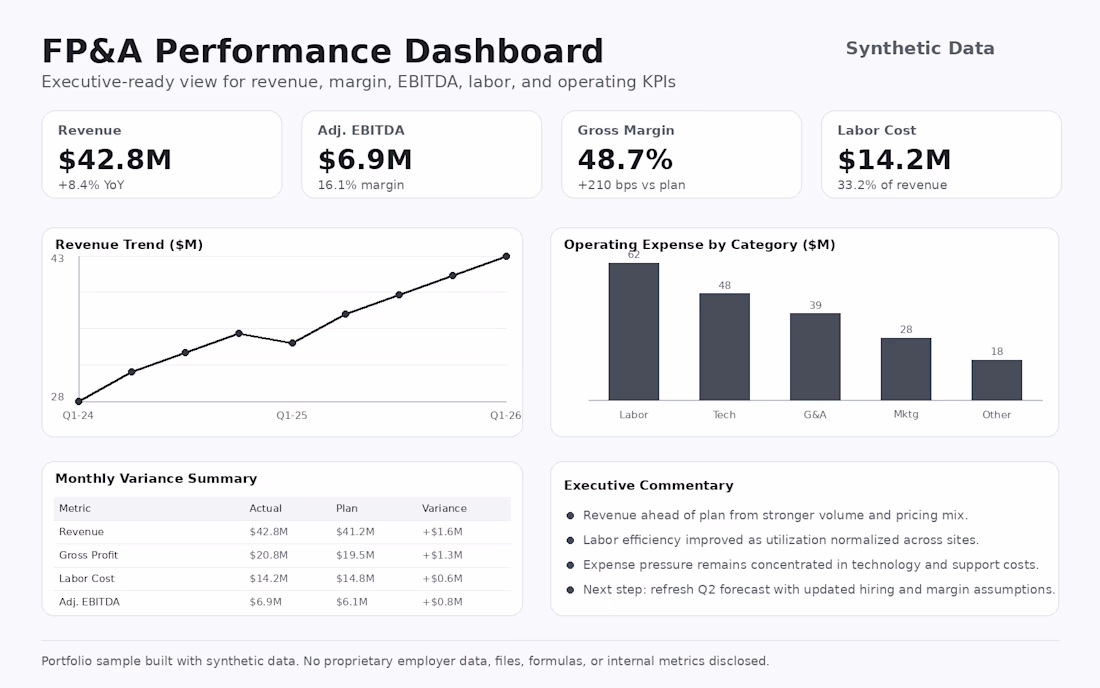
This is a synthetic FP&A dashboard created to demonstrate how I turn financial and operational data into clear, executive-ready reporting. The dashboard highlights key metrics such as revenue, EBITDA, gross margin, labor cost, operating expenses, budget variance, and performance commentary.
The focus of this work is helping leadership quickly understand business performance, identify trends, explain variances, and make better planning decisions. It reflects my experience building KPI dashboards, monthly reporting packages, forecast views, and financial analysis for data-driven organizations.
All data shown is sample data and does not include proprietary employer information.
The network for creativity
Join 1.25M professional creatives like you
Connect with clients, get discovered, and run your business 100% commission-free
Creatives on Contra have earned over $150M and we are just getting started
Related posts
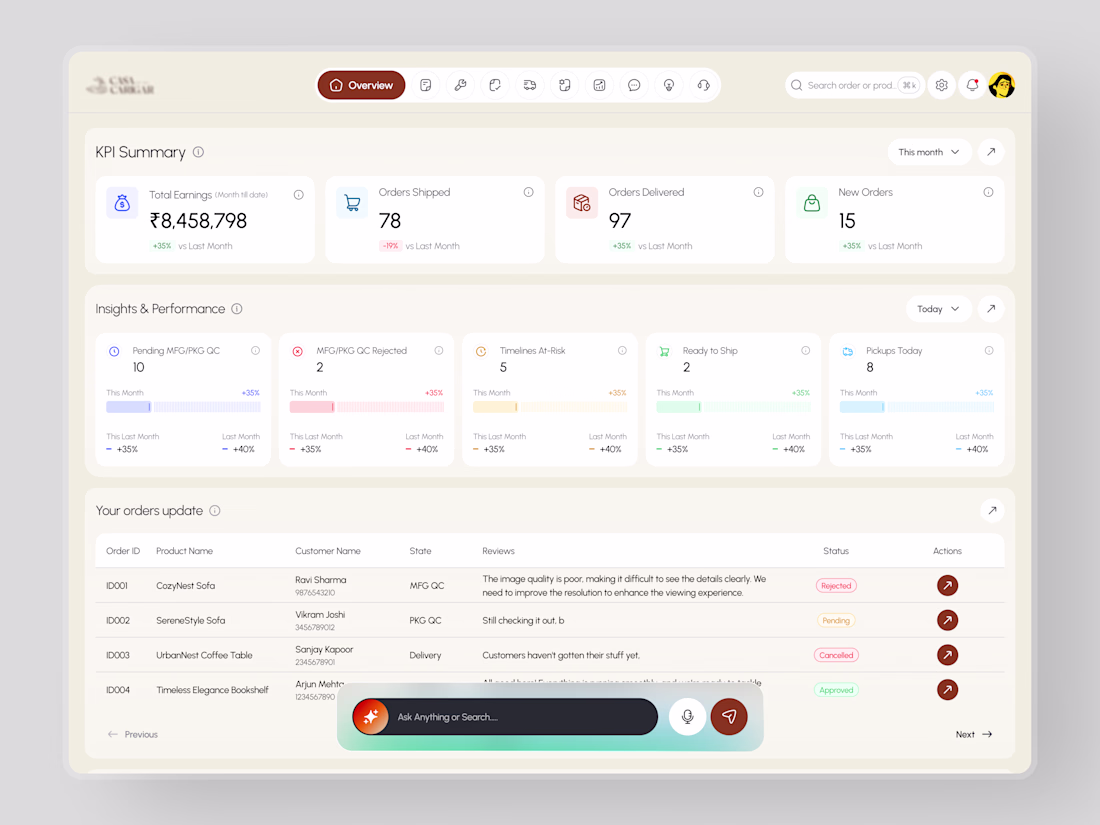
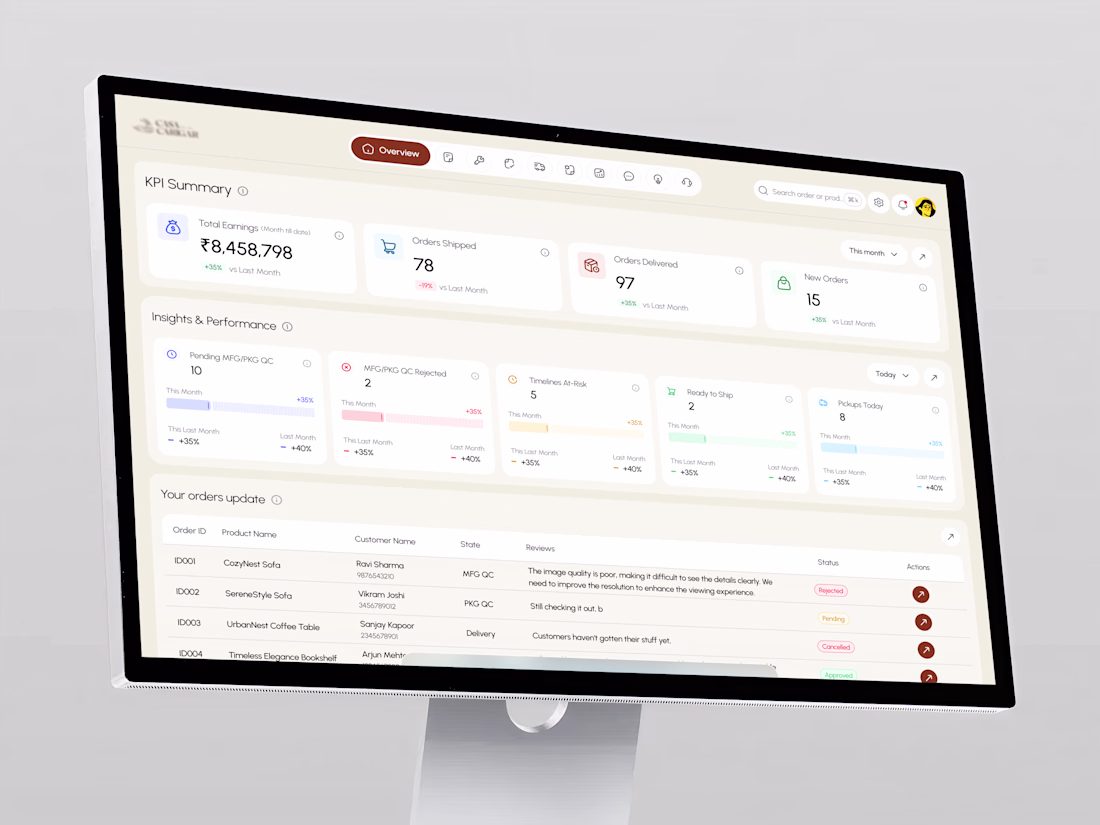
Most e-commerce dashboards show you the data. This one helps you act on it.
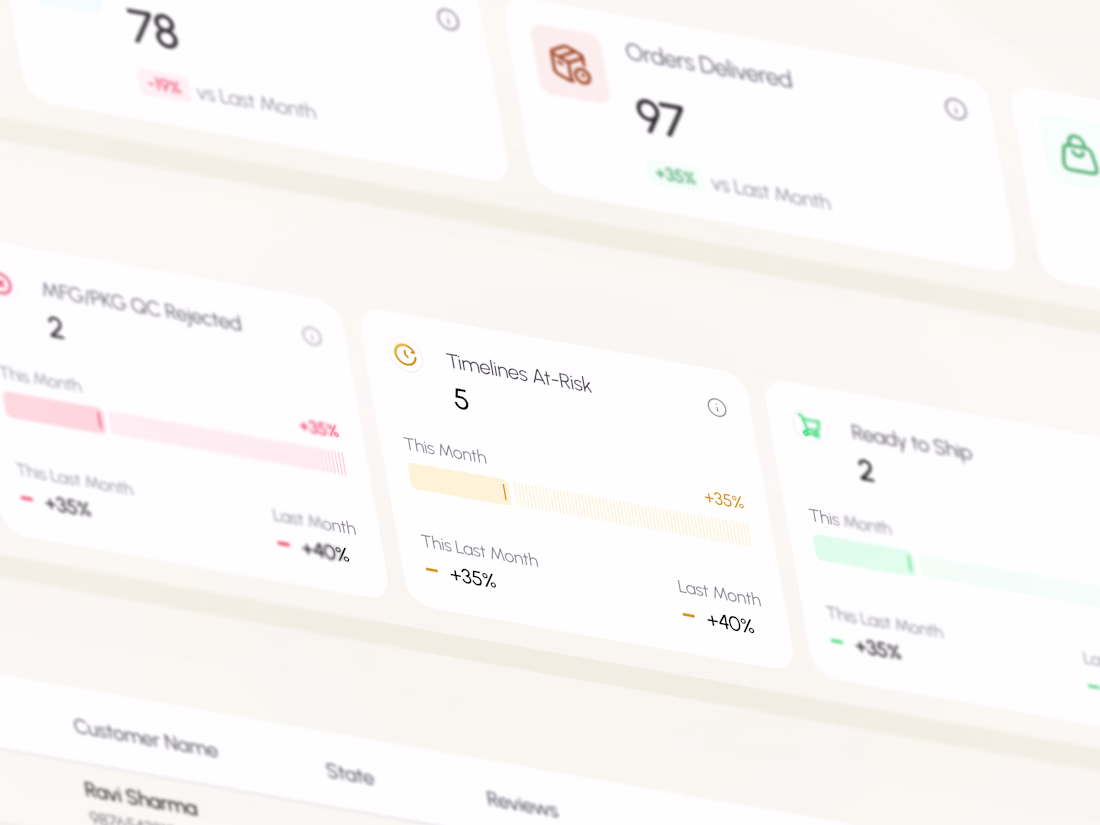
KPI summary, insights and performance, QC tracking, order status, and an AI search bar all on one warm, structured screen. Every number compared to last month. Every at-risk timeline flagged before it becomes a problem.
Cream surface. Dark brown accents. Built for the seller who needs to stay ahead of the day.
Does this feel like a dashboard your ops team would actually open first? 👇
Tools: Figma
#DashboardDesign #EcommerceUI #UIDesign #DataDashboard #ContraFreelance #ProductDesign
This look is incredibly polished.
Data Cleaning & Excel I 5000+ Rows Cleaned I 98% Accuracy I 2 Hours
Cleaned e-commerce sales data with 450+ errors removed. Delivered clean report using Excel + Pivot table.
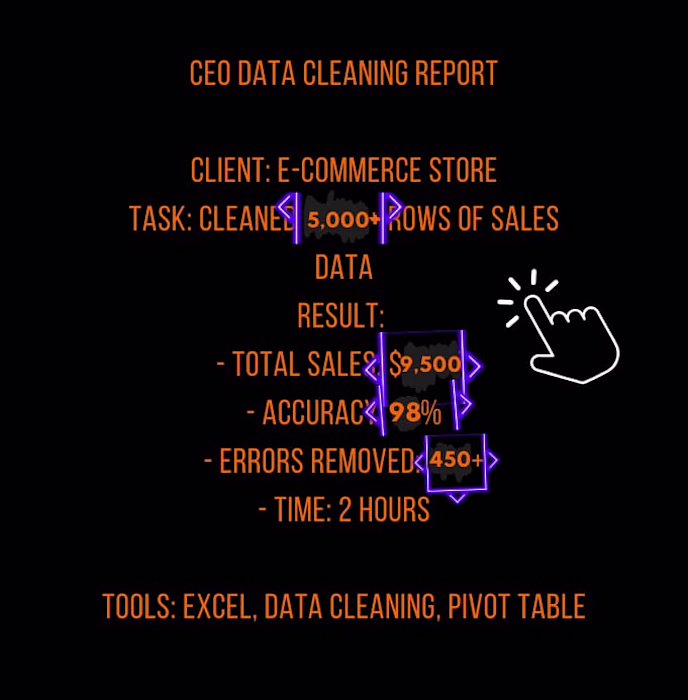
Love how you presented this with actual numbers — 5,000 rows, 450+ errors, 98% accuracy, 2 hours. That's exactly how clients need to see data cleaning work: not just 'I cleaned your data' but here's the measurable impact. The CEO-style report format is a smart touch too. Saving...
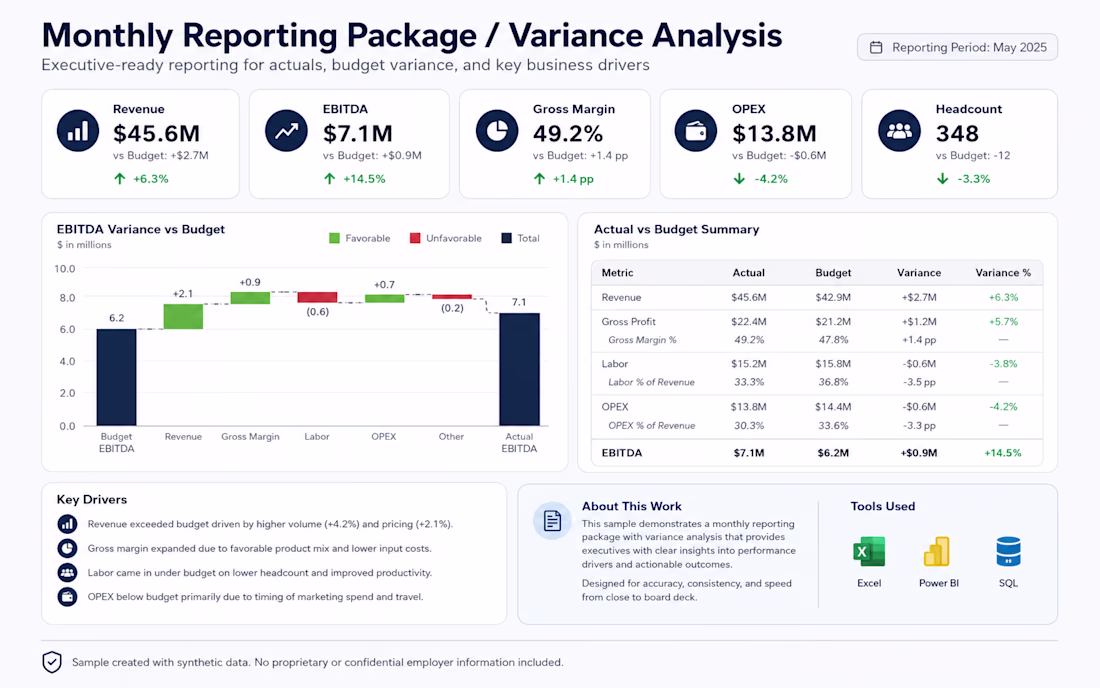
This is a synthetic monthly reporting package created to demonstrate how I summarize financial performance, budget variance, and key business drivers for executive review. The example highlights revenue, EBITDA, gross margin, OPEX, headcount, actuals vs. budget, and variance commentary in a clear, decision-ready format.
The focus of this work is turning financial and operational data into a concise reporting view that helps leadership understand what changed, why it changed, and what actions may be needed. It reflects my experience with FP&A reporting, variance analysis, KPI tracking, forecasting support, and executive-ready finance outputs.
All data shown is sample data and does not include proprietary employer information.
Trending
Claude
Claude has entered the design space. How are you using Claude Design?
Contra University
Learn from expert creatives how to earn more using next-gen AI tools.
MagicPath
The canvas is infinite, and exploration is becoming the workflow. How are you using MagicPath?
creativeaiflow
Creative AI workflows are evolving. What tools do you use, and what are their strengths and weaknesses?
freelancerlife
Freelancer life is wins, pivots, and everything in between. What’s yours right now?