The network for creativity
Join 1.25M professional creatives like you
Connect with clients, get discovered, and run your business 100% commission-free
Creatives on Contra have earned over $150M and we are just getting started
Back to feedPost
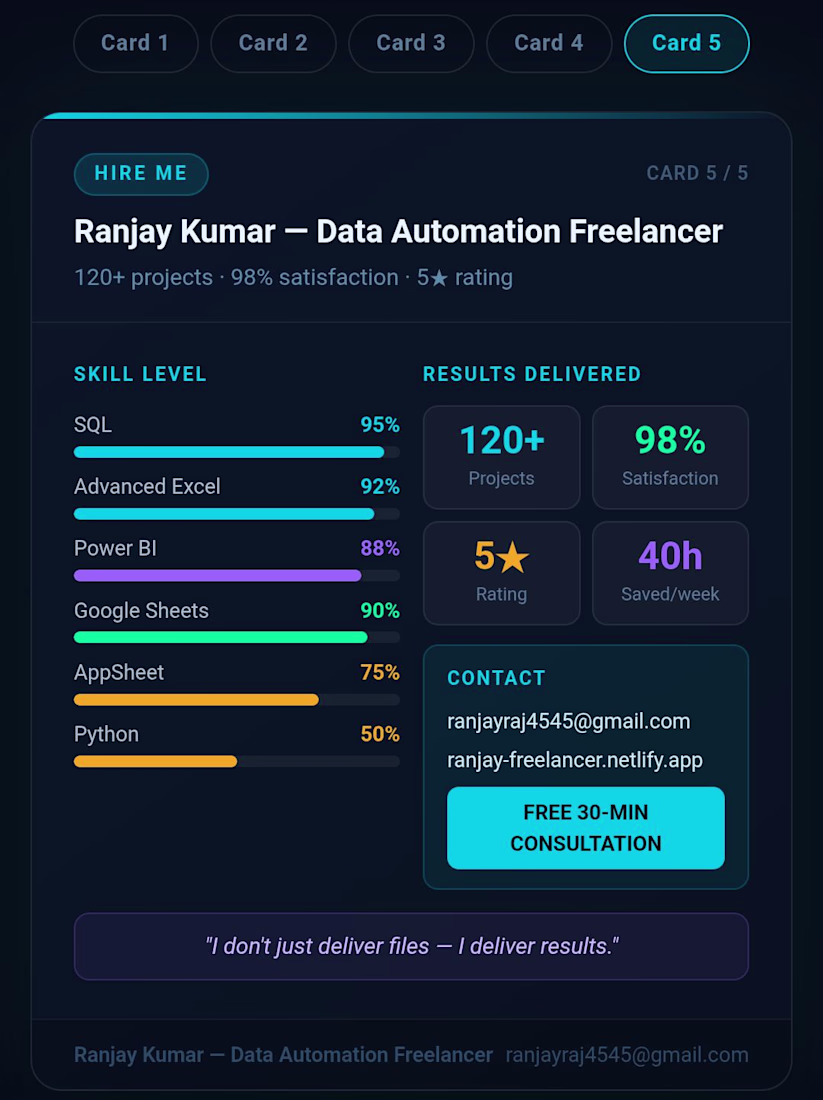
Just built an interactive Workforce Analytics Dashboard in Excel
This project focuses on analyzing employee distribution, compensation trends, and hiring patterns (2015–2025) — all inside Excel.
Key highlights:
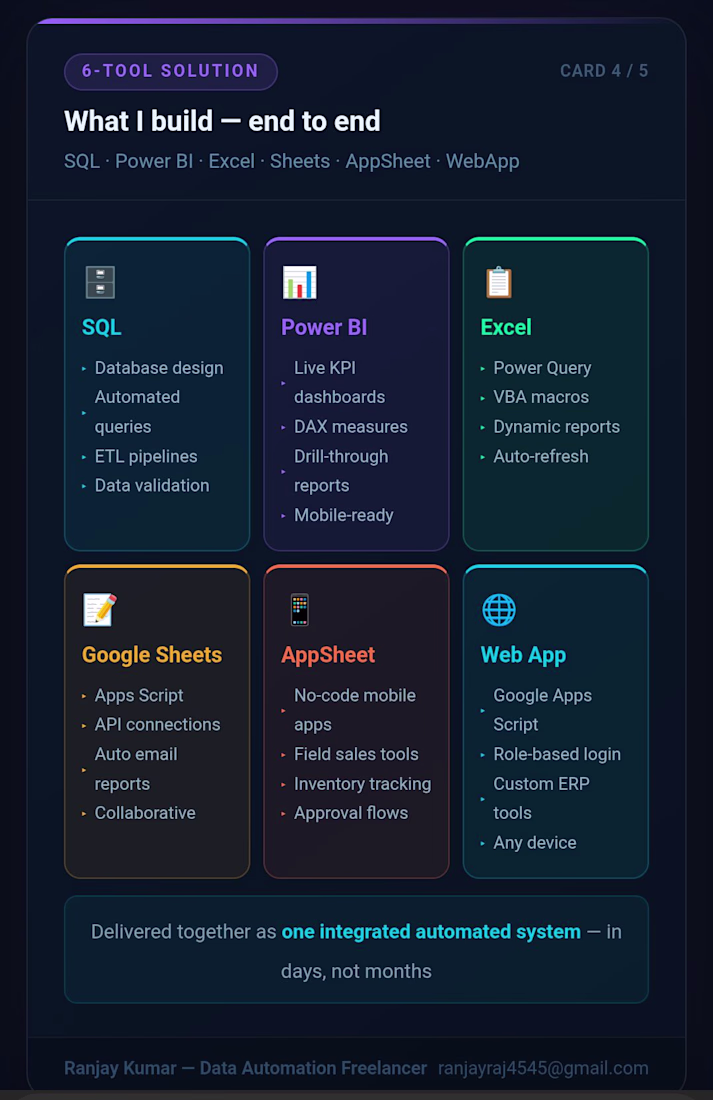
• Connected to a SQL database for dynamic data handling
• Used Power Query + Pivot Tables for transformation & modeling
• Implemented VBA Macros for automation (refresh, navigation, insights)
• Designed an intuitive UI with drill-down insights
What it delivers:
✔ Salary distribution & employee segmentation
✔ Department-wise workforce trends
✔ Hiring trend analysis over time
✔ Automated employee insights (highest paid, tenure, etc.)
This project pushed me to go beyond basic Excel and treat it like a full analytics tool instead of just a spreadsheet.
Still improving — next step is taking this level of analysis into Power BI & Python.
#Excel #DataAnalytics #Dashboard #SQL #DataScience #BusinessIntelligence #Automation
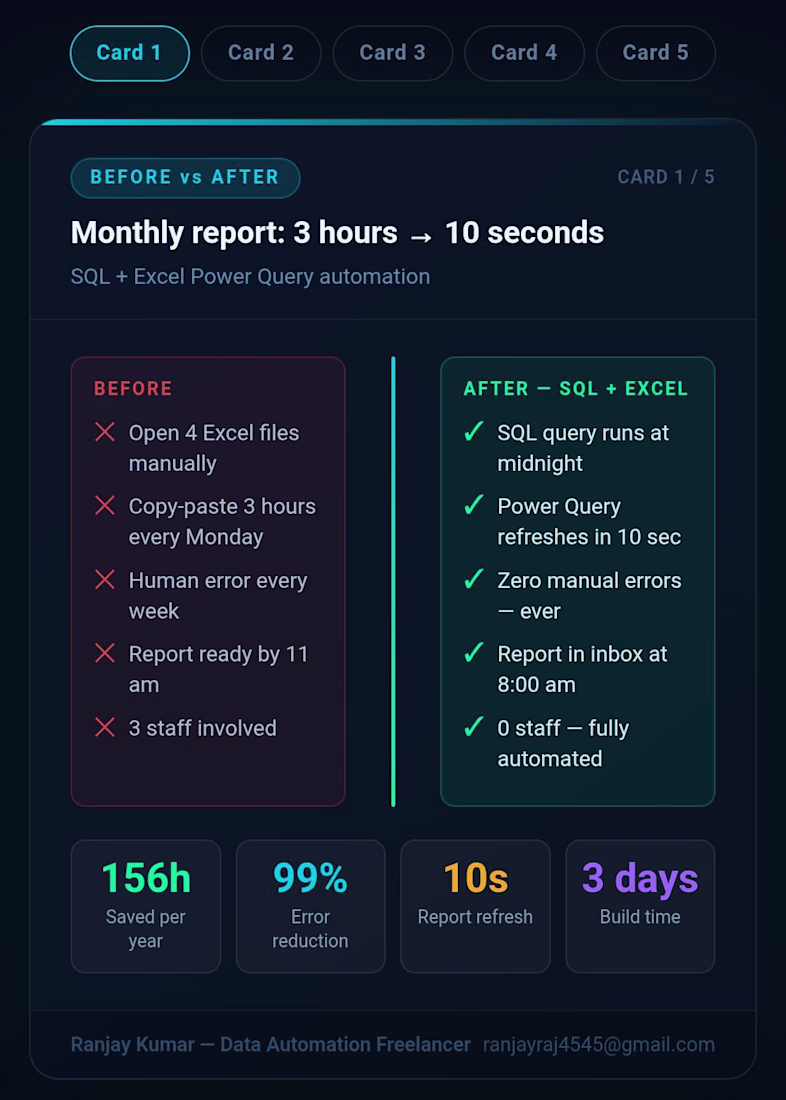
Connecting Excel directly to a SQL database for live data handling is the step most people skip — they export manually and wonder why their dashboard is always a week behind.
The automated employee insights section is really useful for HR teams who spend hours building the same...
well i haven't thought of that yet because i am working on a different sql based project but i may go with power automation.
That makes sense — Power Automate would be the cleaner choice when moving to the Microsoft ecosystem fully. Would be interesting to see how the workflow compares once you get there. Good luck with the SQL project!
The network for creativity
Join 1.25M professional creatives like you
Connect with clients, get discovered, and run your business 100% commission-free
Creatives on Contra have earned over $150M and we are just getting started
Related posts
Building a brand new AI Fintech dashboard components
WIP :)
Cool
I provide professional and accurate data entry services in Microsoft Word and Excel with a strong focus on speed, precision, and clean formatting.
✔ Data entry in Word & Excel
✔ PDF to Word/Excel conversion
✔ Scanned or handwritten document typing
✔ Form filling and online data entry
✔ Data sorting, cleaning & formatting
✔ Tables, lists & structured documents
✔ Professional layout and formatting
Focused on delivering 100% accurate, error-free, and well-organized work with fast and reliable turnaround.
Great perspective, Fayyaz! I saw your post and completely agree—manual data entry is prone to errors.
I specialize in building automation workflows using n8n that can handle the heavy lifting of lead validation, deduplication, and CRM syncing. If you're looking to scale your...
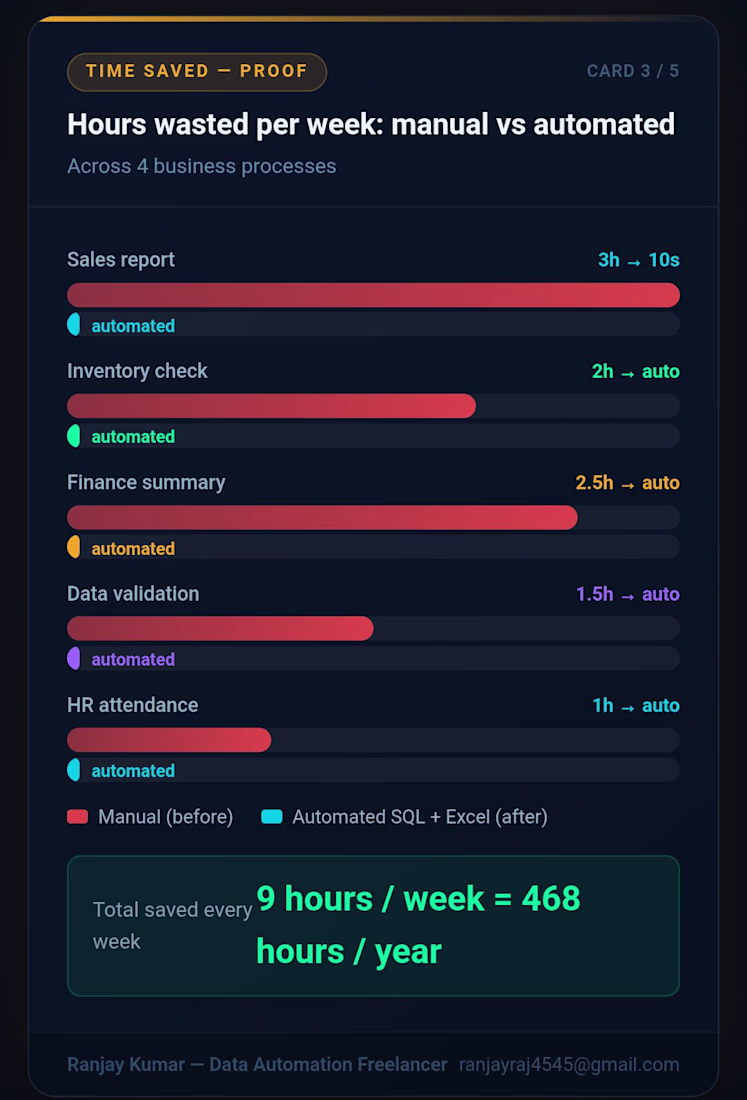
I automated a business workflow using SQL + Excel by connecting multiple Excel files into one system, creating automated data refreshes, building a live dashboard, and scheduling automatic reports — eliminating manual work and saving hours every week.
Trending
Claude
Claude has entered the design space. How are you using Claude Design?
Contra University
Learn from expert creatives how to earn more using next-gen AI tools.
creativeaiflow
Creative AI workflows are evolving. What tools do you use, and what are their strengths and weaknesses?
portfolioreview
The best portfolios tell a story, not just show a grid. Share yours for feedback.
freelancerlife
Freelancer life is wins, pivots, and everything in between. What’s yours right now?