The network for creativity
Join 1.25M professional creatives like you
Connect with clients, get discovered, and run your business 100% commission-free
Creatives on Contra have earned over $150M and we are just getting started
Back to feedPost

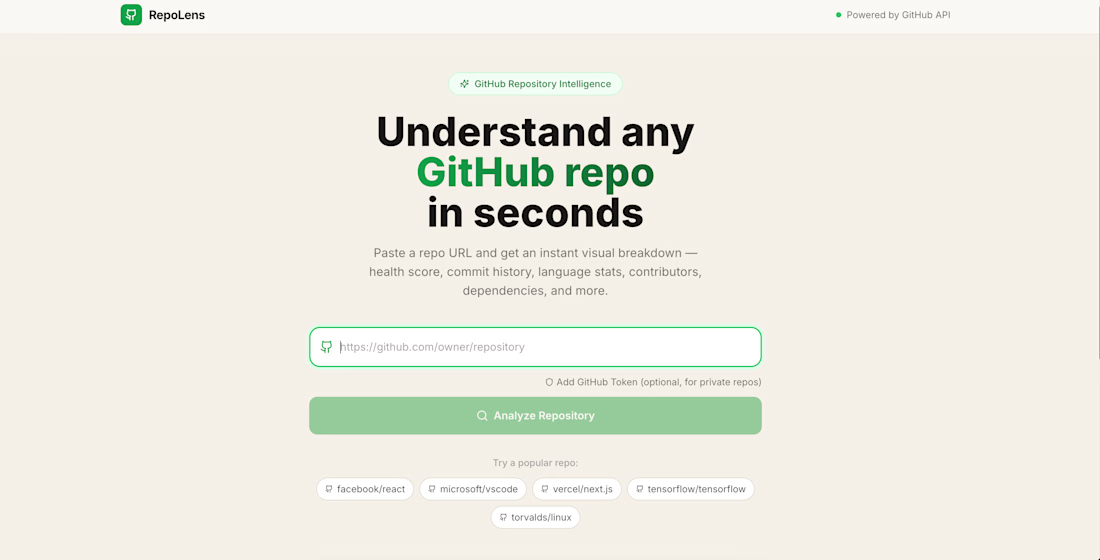
A browser-based tool that turns any GitHub repo into an instant, visual "intelligence report." You paste a GitHub URL and get a full dashboard back — no sign-up, no auth, no friction. It's a developer-tool / analytics product.
Core features
Health Score (0–100) — production-readiness rating across 7 quality dimensions, with letter grades
Language pie chart — interactive breakdown of language composition
Commit heatmap — GitHub-style 52-week activity grid
Contributor rankings — top 10 contributors with avatars + metrics
Smart dependency detection — parses package.json, requirements.txt, Cargo.toml, go.mod, pom.xml, Gemfile
File tree browser — collapsible directory viewer with file-type icons
README rendering — full GitHub-flavored Markdown with syntax highlighting
Share cards — export a PNG summary for social media
Tech stack
LayerTechFrontendReact 18, Vite, Tailwind CSS, Recharts, react-markdownBackend (optional)Python 3.12, FastAPI, httpx, file-based caching, slowapi rate limitingDeployGitHub Pages (frontend), Railway (backend, optional)
How it works
The frontend runs entirely in the browser and talks directly to GitHub's REST API — that's why the live demo needs no setup or login (limited to ~60 requests/hour unauthenticated). The FastAPI backend is optional, and only exists to add caching and rate-limit relief when you self-host.
Run it locally
Or docker compose up --build.


The network for creativity
Join 1.25M professional creatives like you
Connect with clients, get discovered, and run your business 100% commission-free
Creatives on Contra have earned over $150M and we are just getting started




Related posts

Which style wins for you? 🤔
We’re testing out two theme directions for Avenra’s dashboard component cards; featuring real-time spending breakdowns, project progress metrics, and time-off tracking.
Curious to hear your thoughts! 💬

8 voted
42%
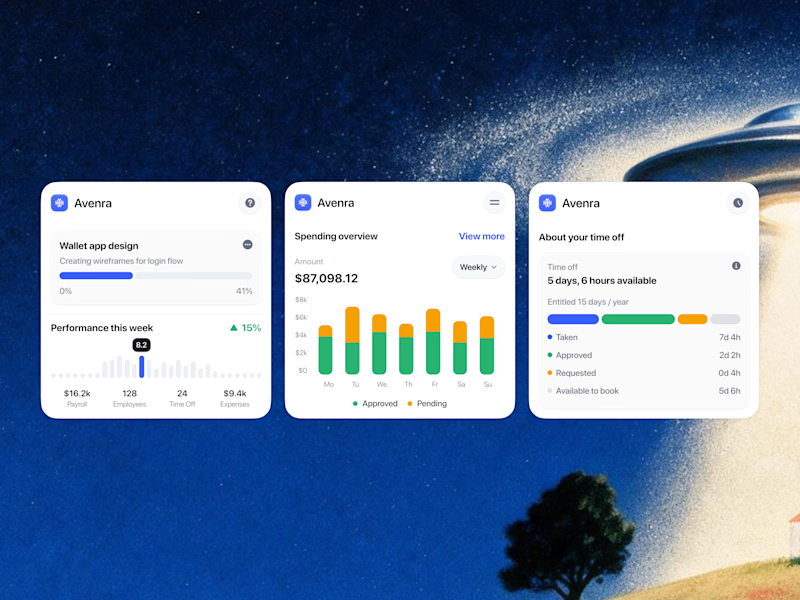
11 voted
58%
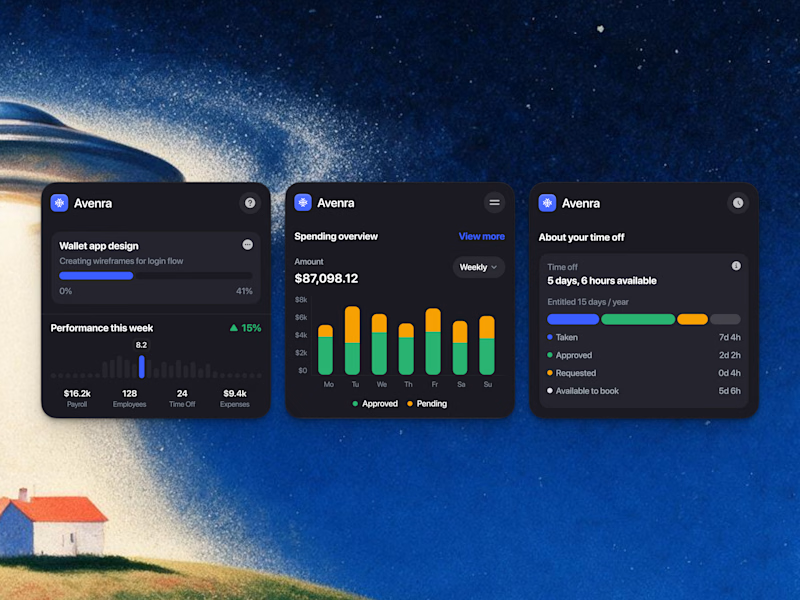
19 votes
Closed

Everyone thinks a data dashboard should look complicated.
I think that is exactly why most of them fail.
I just finished Helios, a tool that tracks solar energy assets in real time. Dozens of sites, live output, verification records, a wall of numbers. The kind of screen people drown in.
Most designers would make it feel technical. More lines, more glow, more charts. I did the opposite. Every number had to answer one question in half a second, is this good or is this a problem. If it could not, it lost its place.
Because design is not decoration, it is closer to math. It is deciding what to remove until only the truth is left.
Complexity was never the enemy. Confusion is.
Get that right, and people trust you before you have said a word.
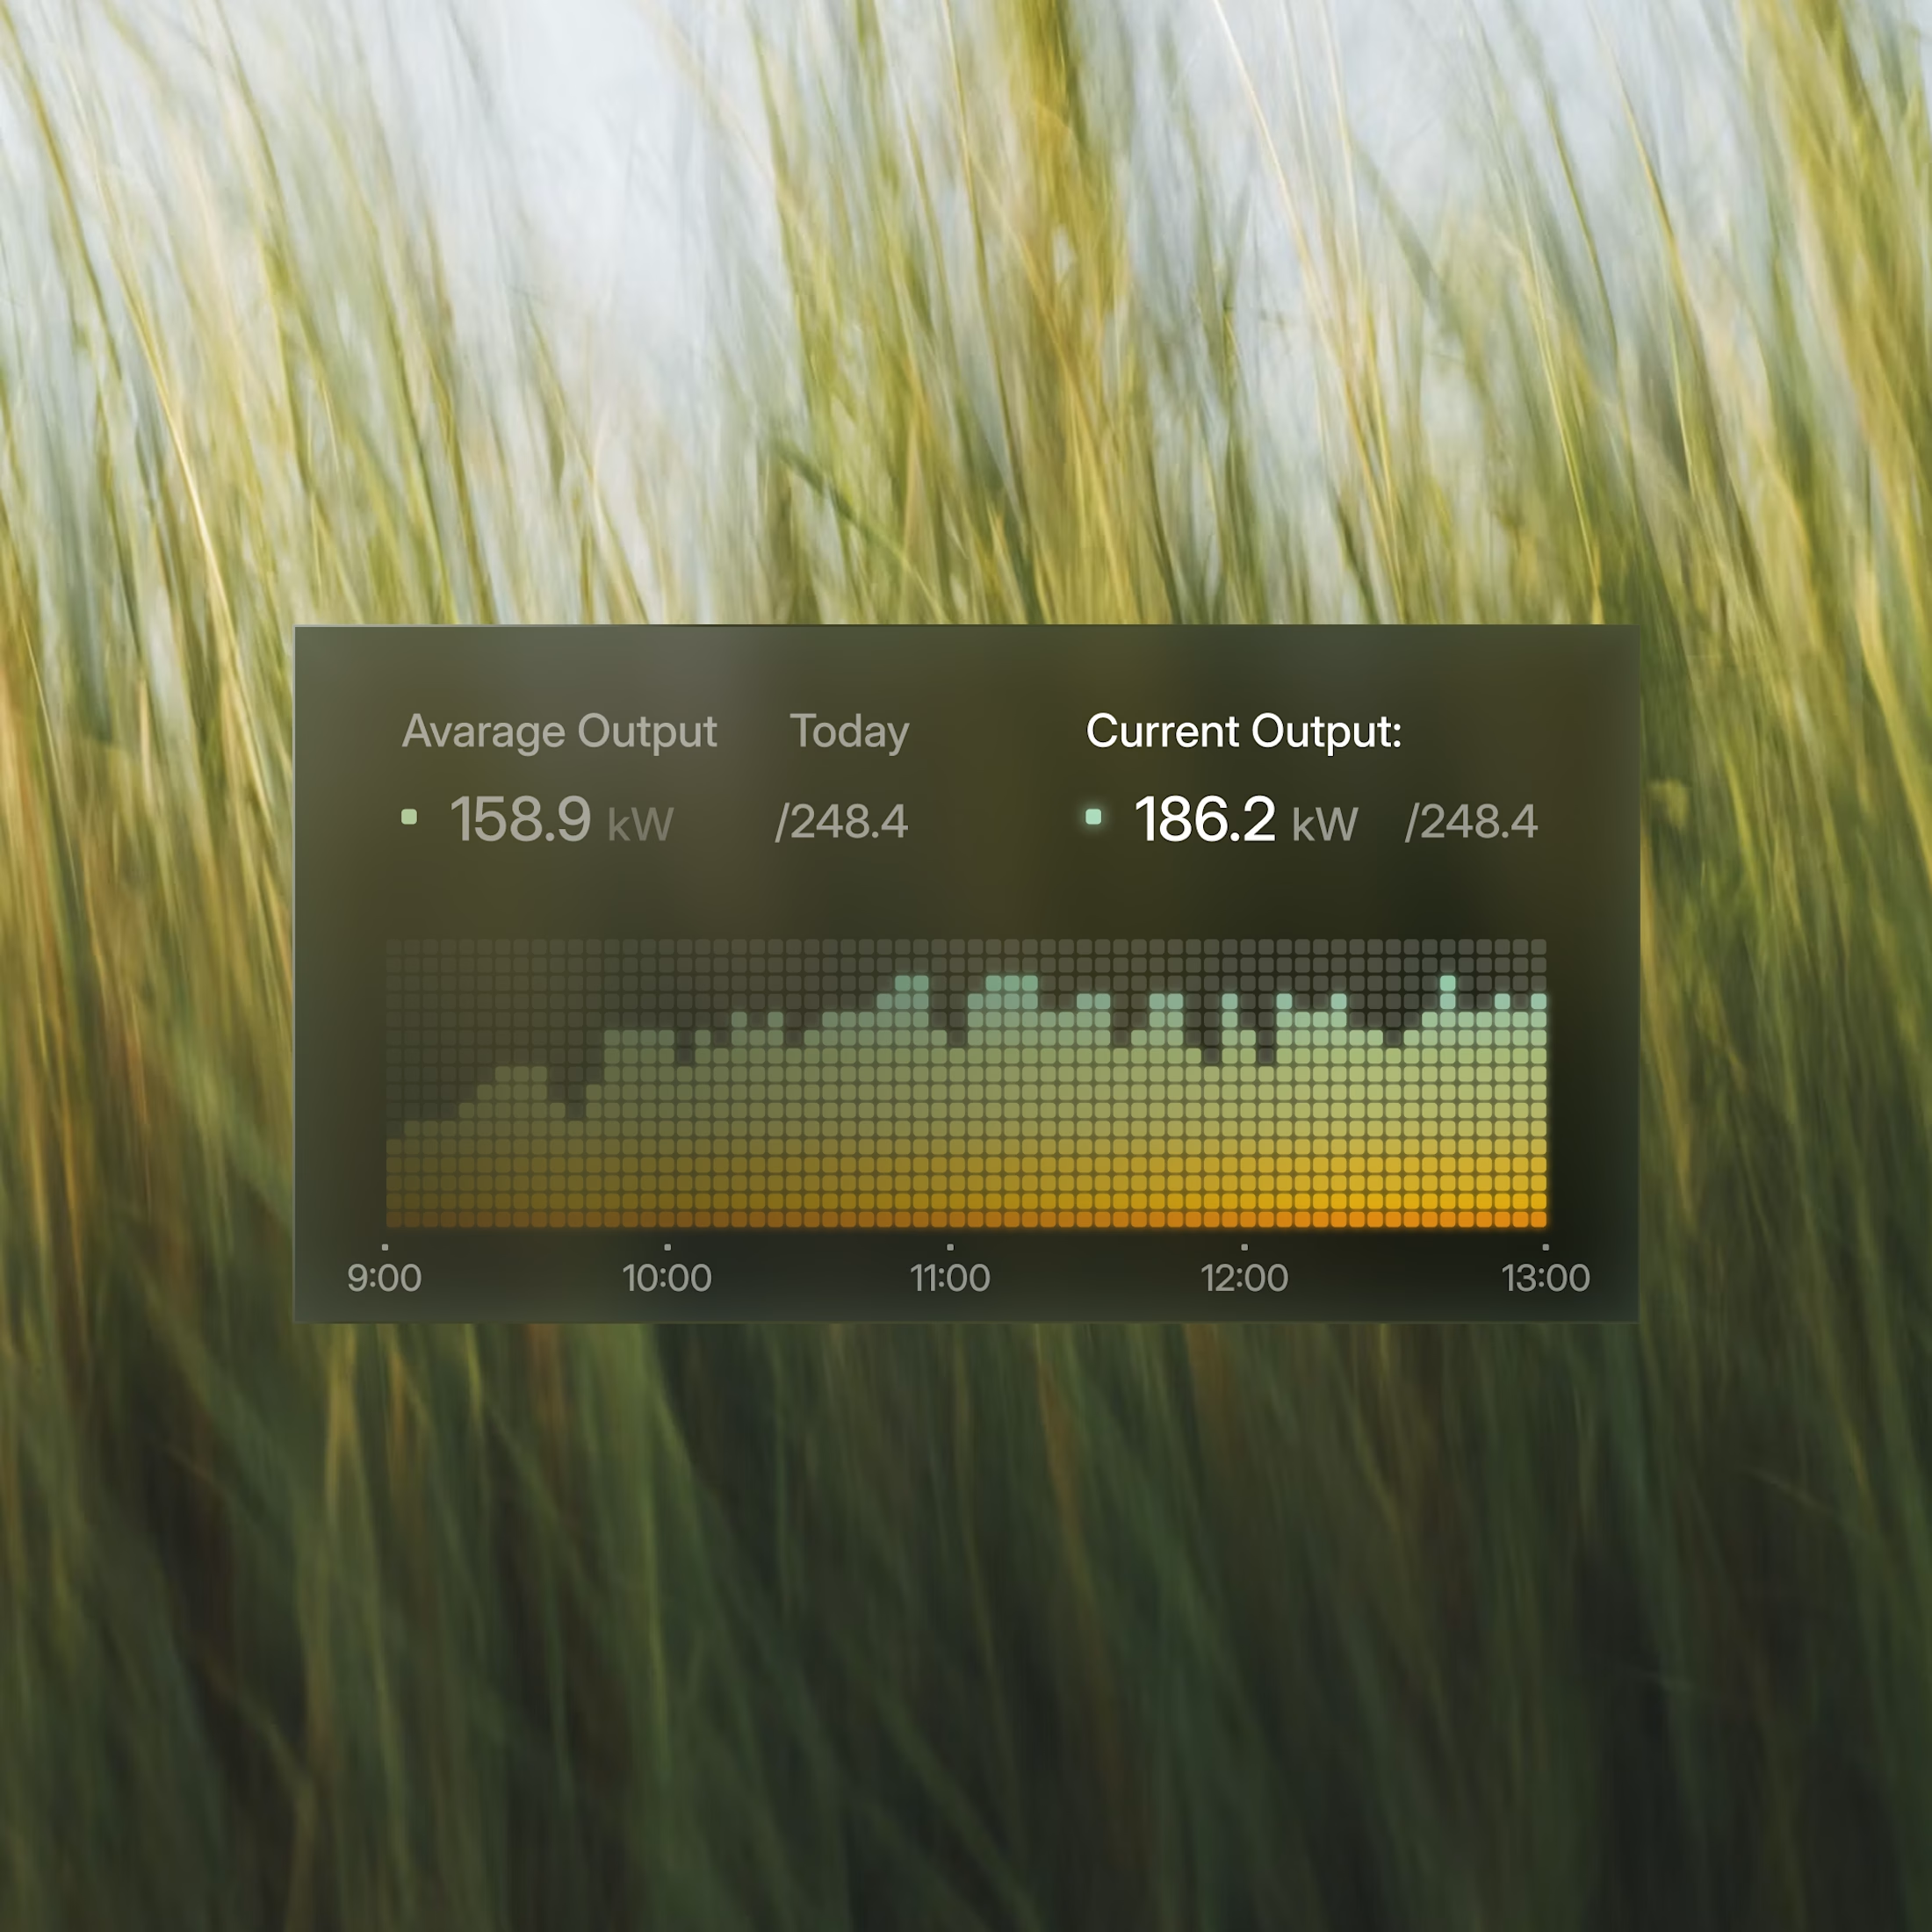
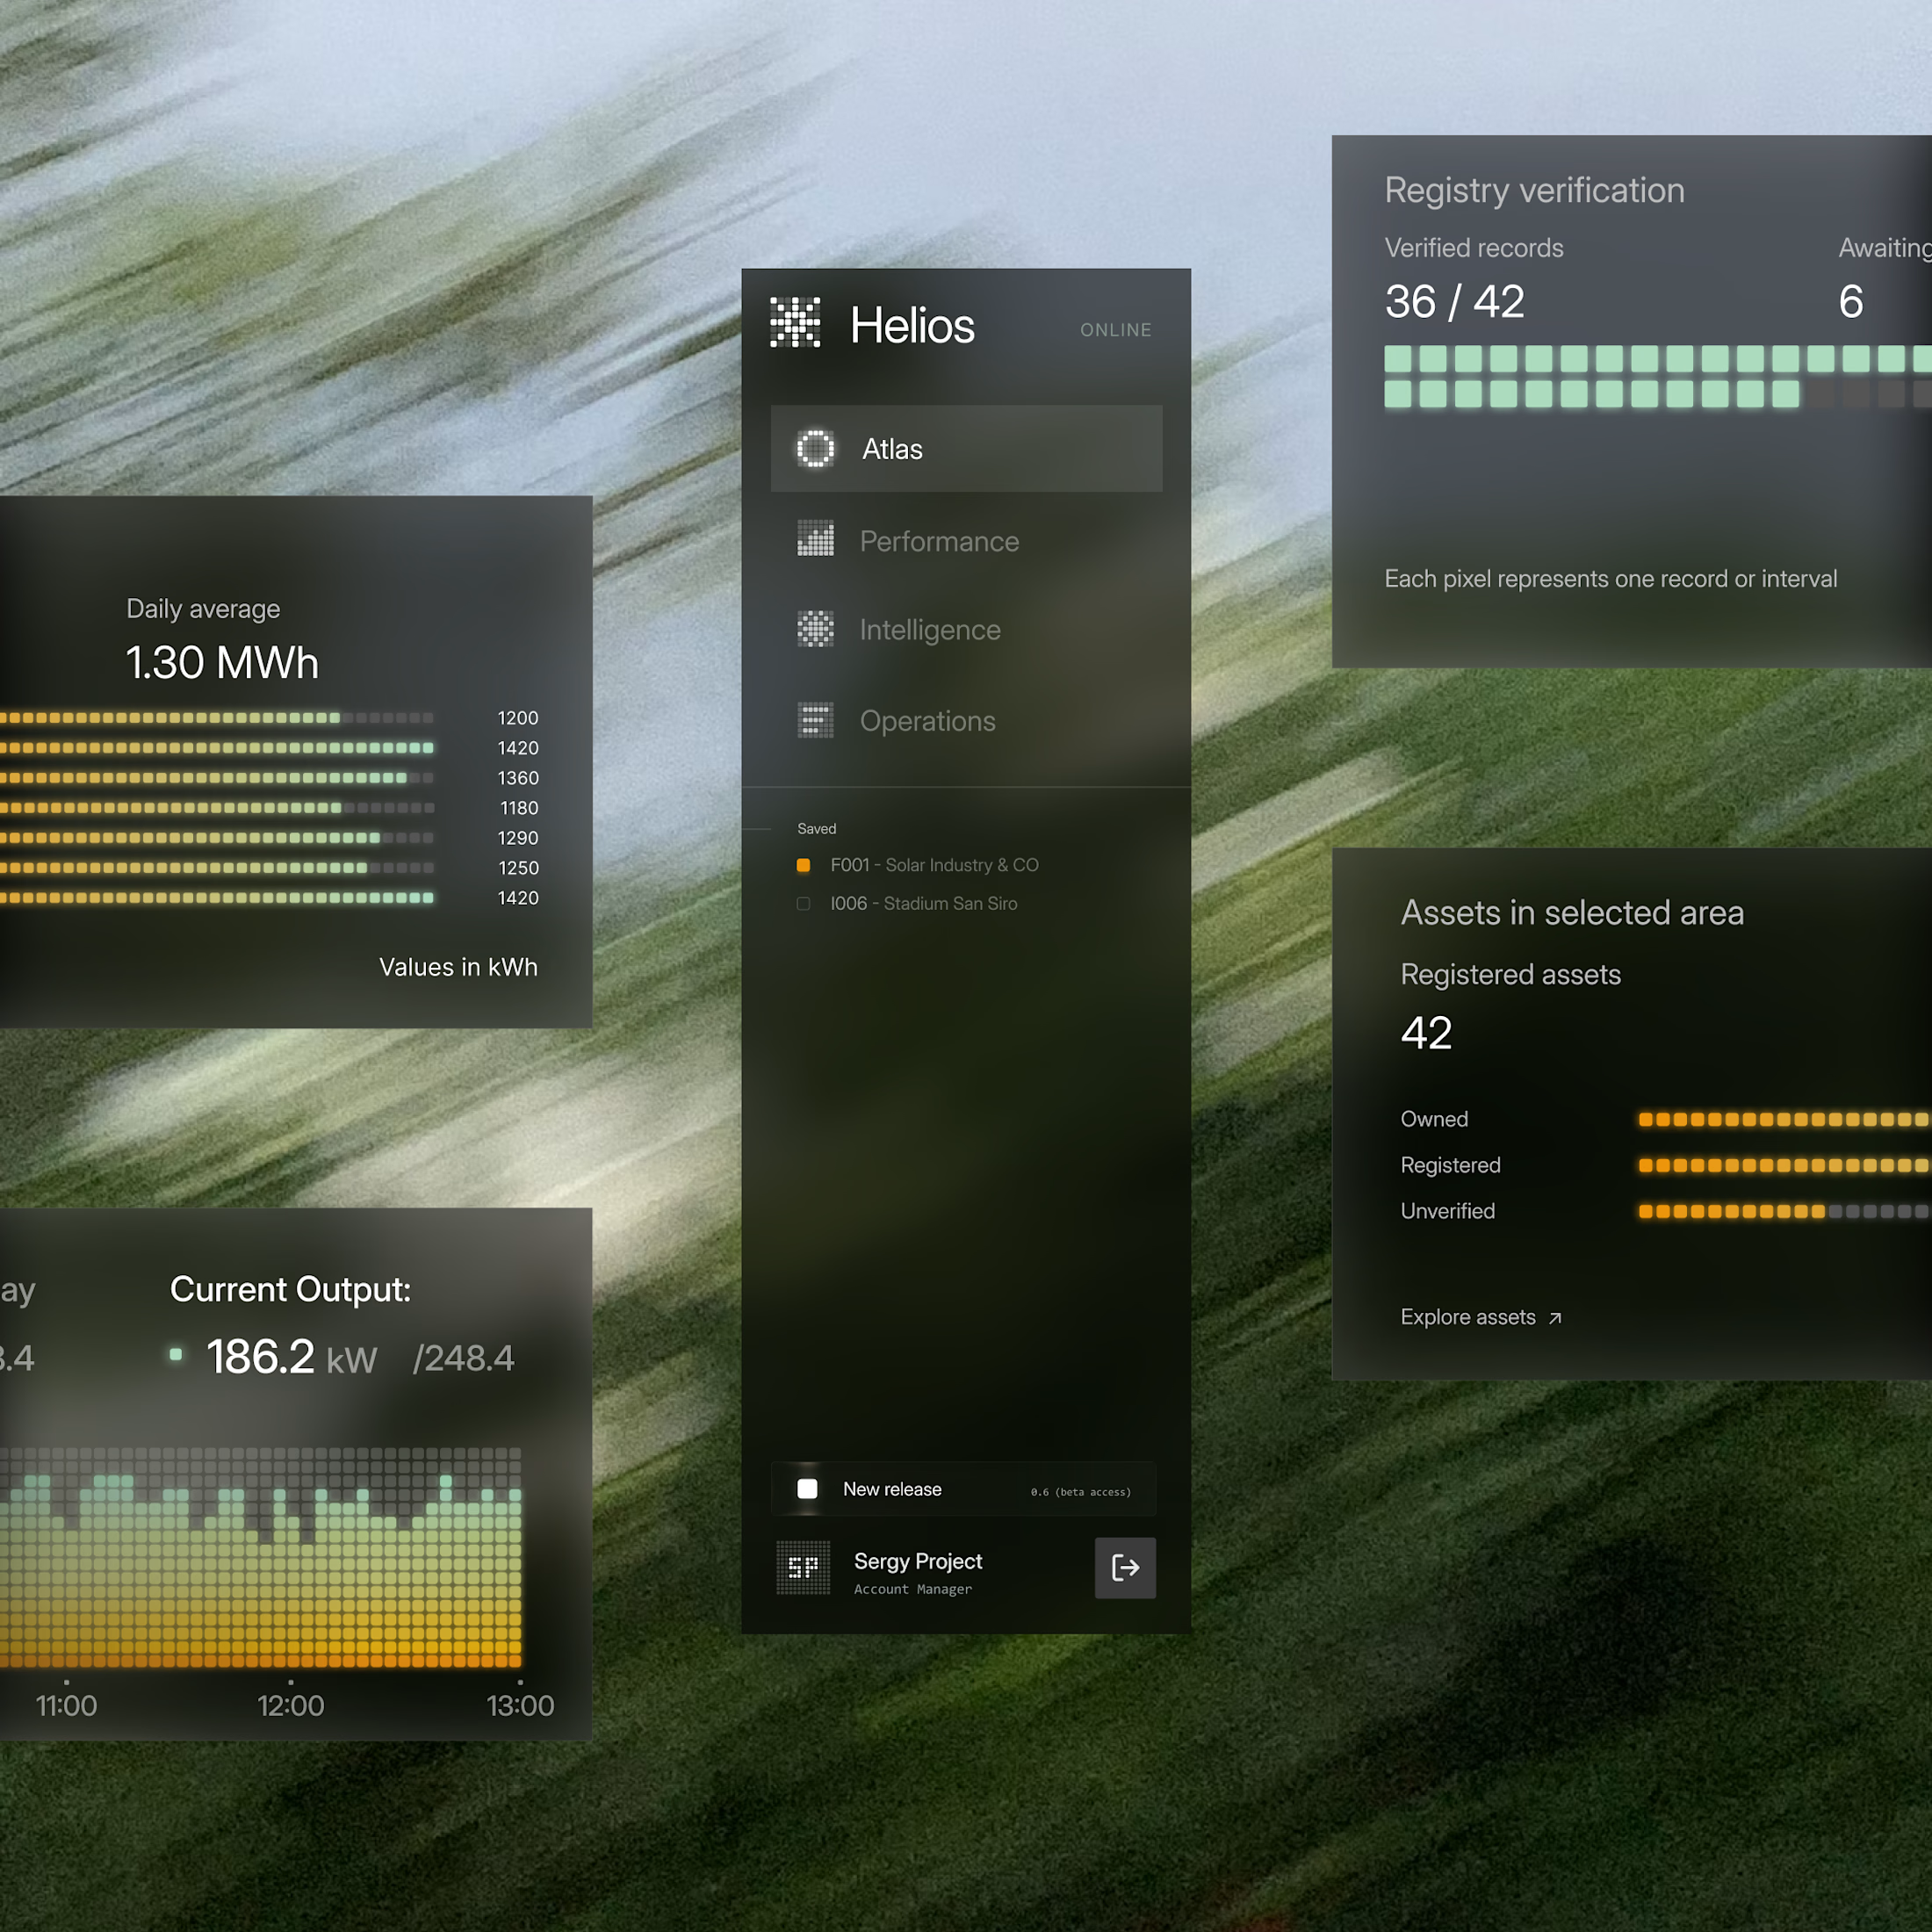

These components are perfectly executed, and the background is perfect for them.

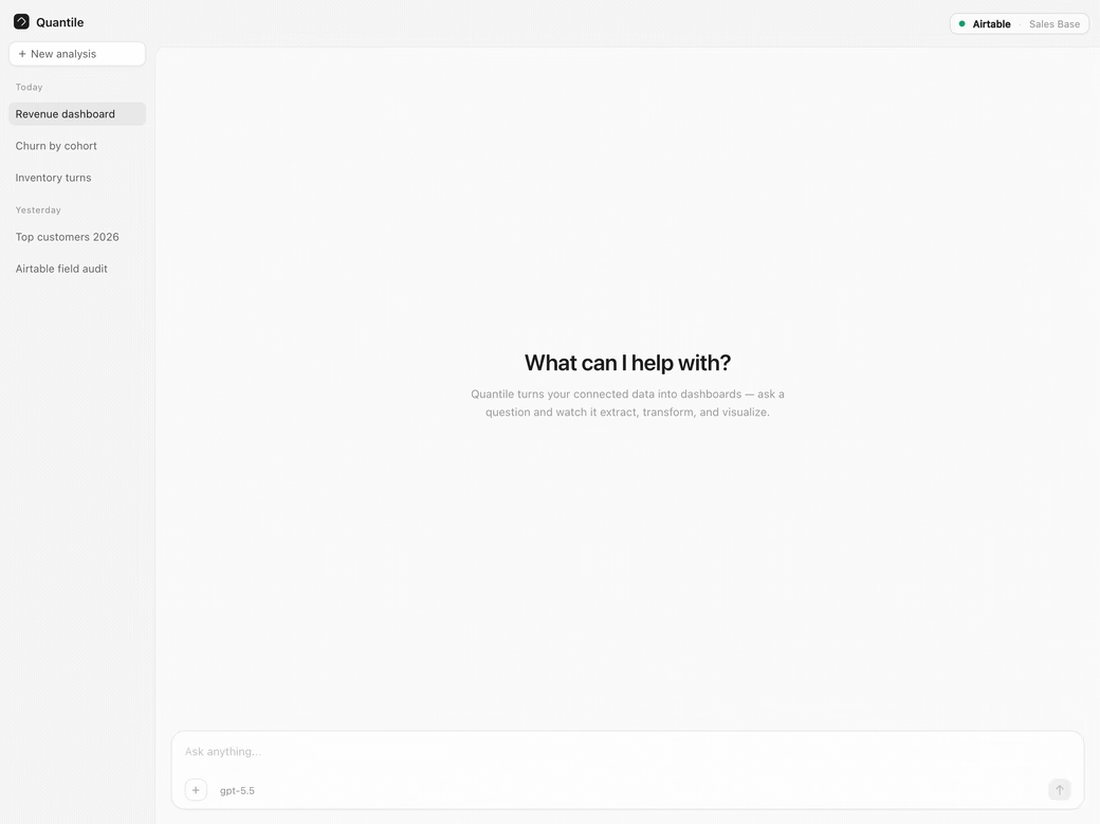
Recently I completed a very interesting - Quantile, an AI backed Business Analytics Software. Chat with your data - and build dashboards through code. Check it out!


quantile is a fun name. chat to dashboards is a cool idea