The network for creativity
Join 1.25M professional creatives like you
Connect with clients, get discovered, and run your business 100% commission-free
Creatives on Contra have earned over $150M and we are just getting started
Back to feedPost

Description:
Produced a full monthly management report for a UK limited company, covering cash position, profitability, balance sheet, and creditor/debtor ageing in one client-ready document. The pack includes:
• Executive Summary — month-on-month variance across cash, profitability, balance sheet, and key performance ratios (gross/net margin, return on investment, current ratio)
• Cash Summary — full income and expense breakdown against year-to-date averages, with variance flagged line by line
• Profit & Loss — trading income, cost of sales, and operating expenses with prior-month and YTD comparisons
• Balance Sheet — assets, liabilities, and equity as at month-end
• Aged Receivables & Payables — outstanding balances aged by due date, so cash risk is visible at a glance
• Bank Reconciliation Summary
Delivered as a polished, board-ready PDF the client can hand straight to directors or investors — no manual formatting required each month.


The network for creativity
Join 1.25M professional creatives like you
Connect with clients, get discovered, and run your business 100% commission-free
Creatives on Contra have earned over $150M and we are just getting started



Related posts

This is what "reconciled" actually looks like: every transaction matched, nothing sitting in an unexplained bucket, the ending balance tying out to the bank statement exactly.
A lot of people have never seen this screen. If yours doesn't look like this, it's worth asking whoever handles your books to show you.

Project Overview
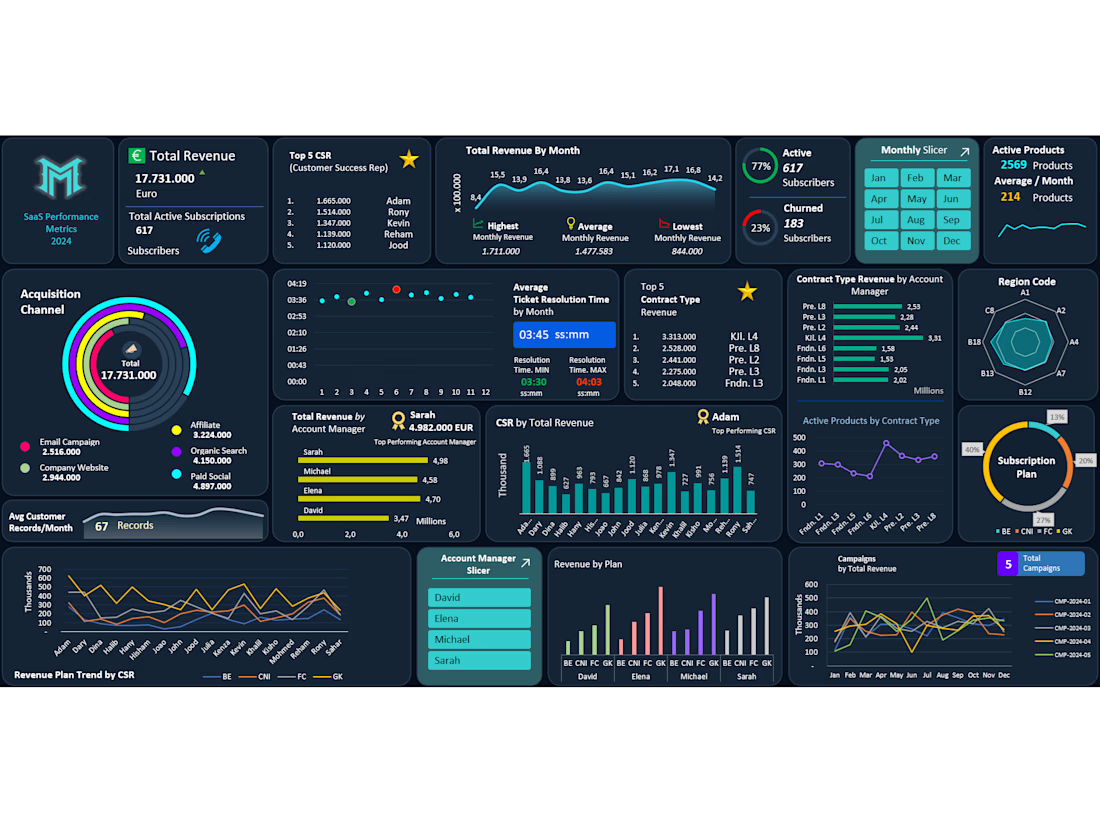
Designed and developed an end-to-end, interactive SaaS Performance Metrics Dashboard to track €17.73M in annual revenue, subscriber retention, acquisition channels, and team performance across 12 months. Built on a robust backend data architecture powered by 23 interconnected Pivot Tables, enabling seamless dynamic filtering via Monthly and Account Manager slicers.
Key Business Metrics & Insights Tracked:
Revenue & Subscription Health: Monitored €17.73M Total Revenue (Peak: €1.71M/month, Avg: €1.48M/month) alongside 617 Active Subscribers (77% retention) vs. 23% Churn rate (183 subscribers) and 2,569 Active Products.
Customer Acquisition Channels: Analyzed ROI across 5 core channels—identifying Paid Social (€4.89M) and Organic Search (€4.15M) as top revenue drivers, followed by Affiliate (€3.22M), Website (€2.94M), and Email Campaigns (€2.51M).
Team & Account Manager Performance: Evaluated individual contributions, highlighting top-performing Account Manager (Sarah – €4.98M) and Top 5 Customer Success Representatives (CSR Leader: Adam – €1.66M).
Operational Efficiency & SLA: Tracked monthly Average Ticket Resolution Time (03:45 min avg, ranging from 03:30 to 04:03) to ensure high customer satisfaction and lower churn.
Product, Contract & Regional Breakdown: Visualized multi-dimensional trends across Subscription Plans (BE, CNI, FC, GK), Contract Types, Regional distribution (Radar Chart), and 5 Marketing Campaigns.
Technical Highlights:
Engineered a complex backend using 23 Pivot Tables and advanced formulas for automated calculations.
Designed a modern Dark Mode UI/UX with custom radial bar charts, line/area trends, radar charts, and dynamic KPI cards for executive-level storytelling.
Integrated interactive Monthly and Account Manager Slicers for instant drill-down analysis.