The network for creativity
Join 1.25M professional creatives like you
Connect with clients, get discovered, and run your business 100% commission-free
Creatives on Contra have earned over $150M and we are just getting started
Back to feedPost

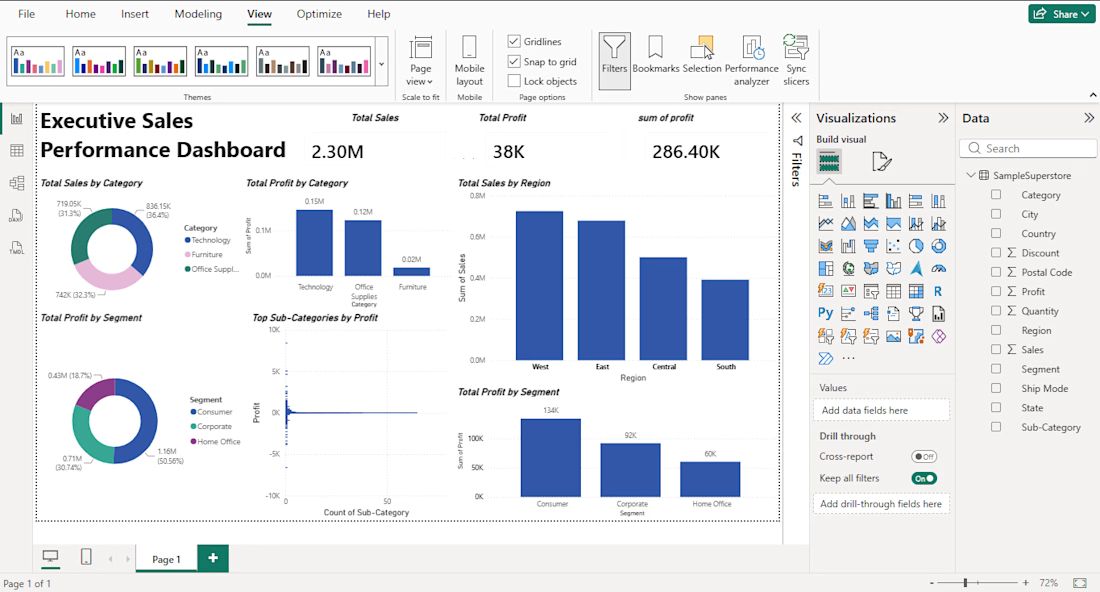
This project is an interactive Power BI dashboard developed to analyze sales performance, profitability, customer segments, and regional trends.
Key Metrics
Total Sales: $2.30M
Total Profit: $286.40K
Total Quantity Sold: 38K+
Key Insights
West region generated the highest sales and profit.
Consumer segment contributed the highest revenue and profit.
Technology category showed strong business performance.
Tools Used
Power BI
Data Visualization
Business Analytics
KPI Reporting
Skills Demonstrated
Dashboard Design
Data Storytelling
Business Intelligence
KPI Analysis
Data Analytics


The network for creativity
Join 1.25M professional creatives like you
Connect with clients, get discovered, and run your business 100% commission-free
Creatives on Contra have earned over $150M and we are just getting started











Related posts

How I Built an End-to-End Sales Analytics Dashboard in Excel for an E-commerce Company
I recently completed an end-to-end sales analytics project using Microsoft Excel, transforming raw e-commerce sales data into an interactive dashboard that provides meaningful business insights.
In this project, I explored the data, performed analysis, identified key sales trends, and built an interactive dashboard to help businesses make data-driven decisions.
I documented the entire process, including the approach, tools, analysis, and dashboard development.
Read the full project walkthrough on Medium: https://medium.com/@Refino/how-i-built-an-end-to-end-sales-analytics-dashboard-in-excel-for-an-e-commerce-company-e8692d81f354


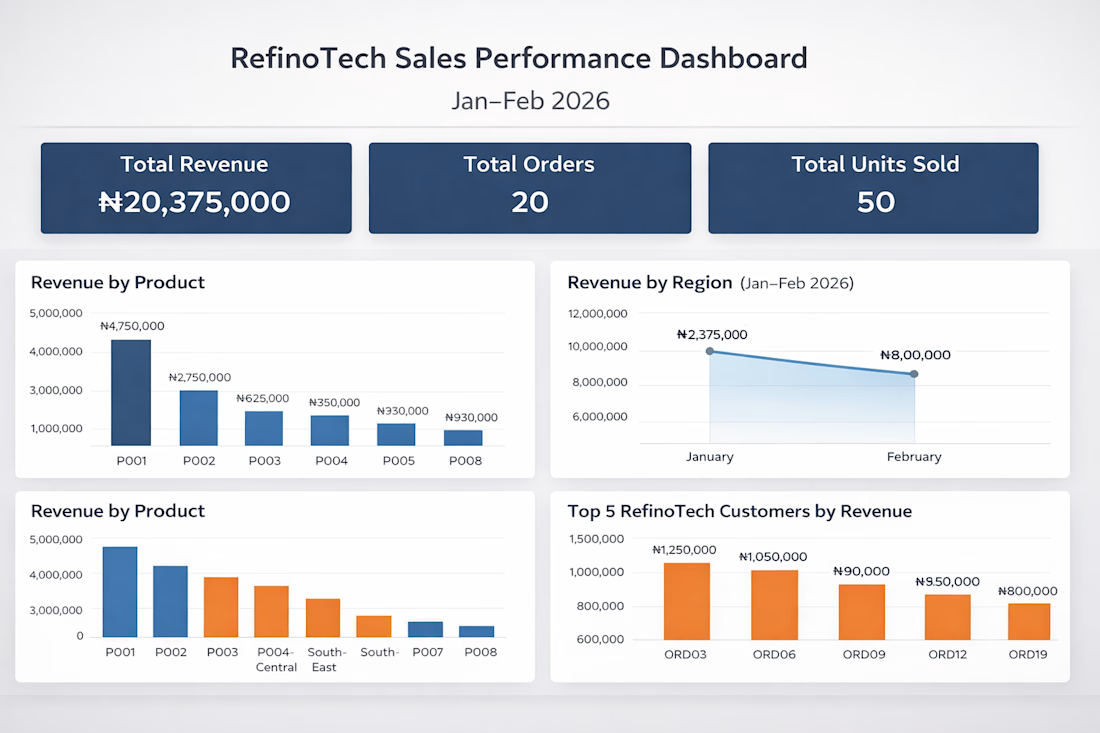

Excellent work! Turning raw data into actionable business insights is a valuable skill.


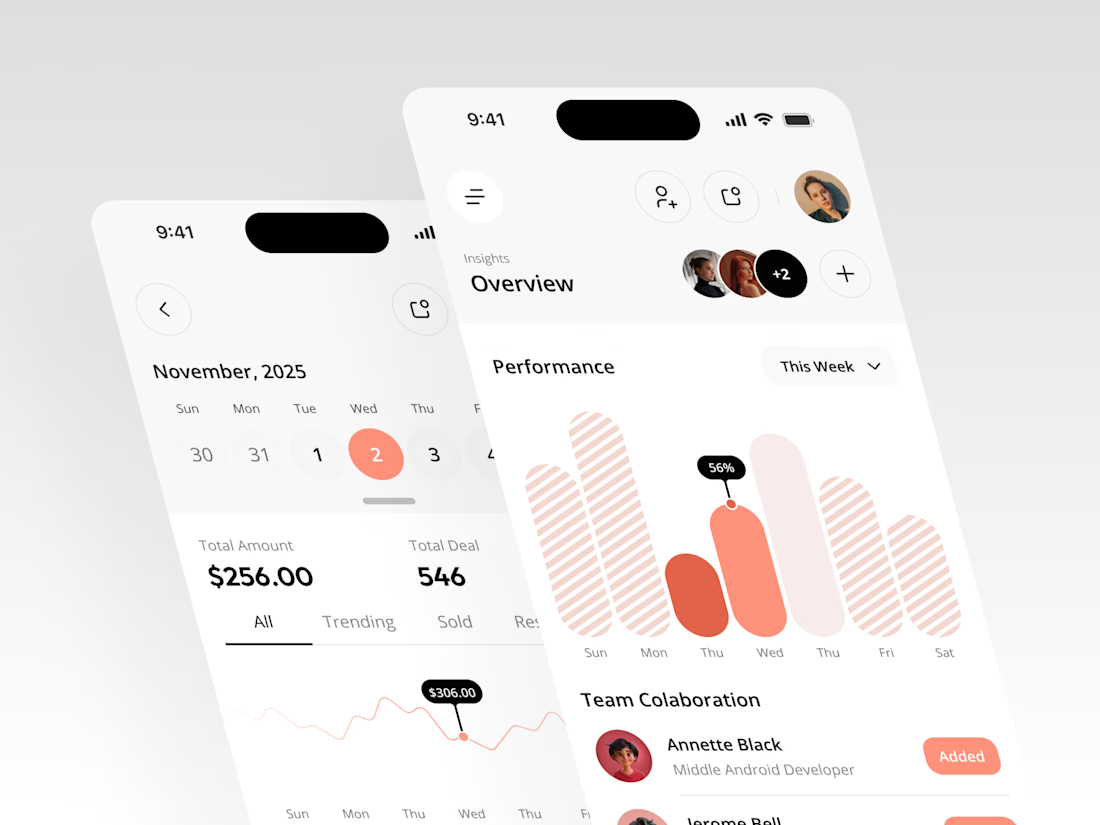
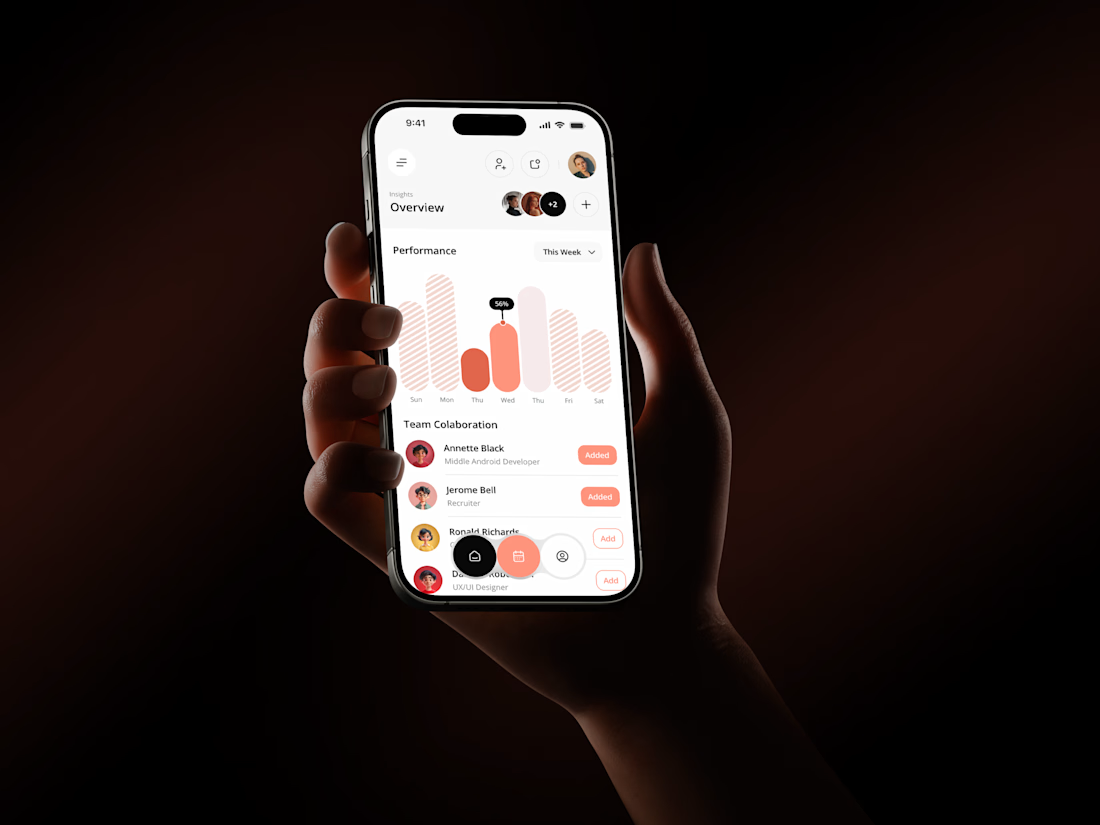
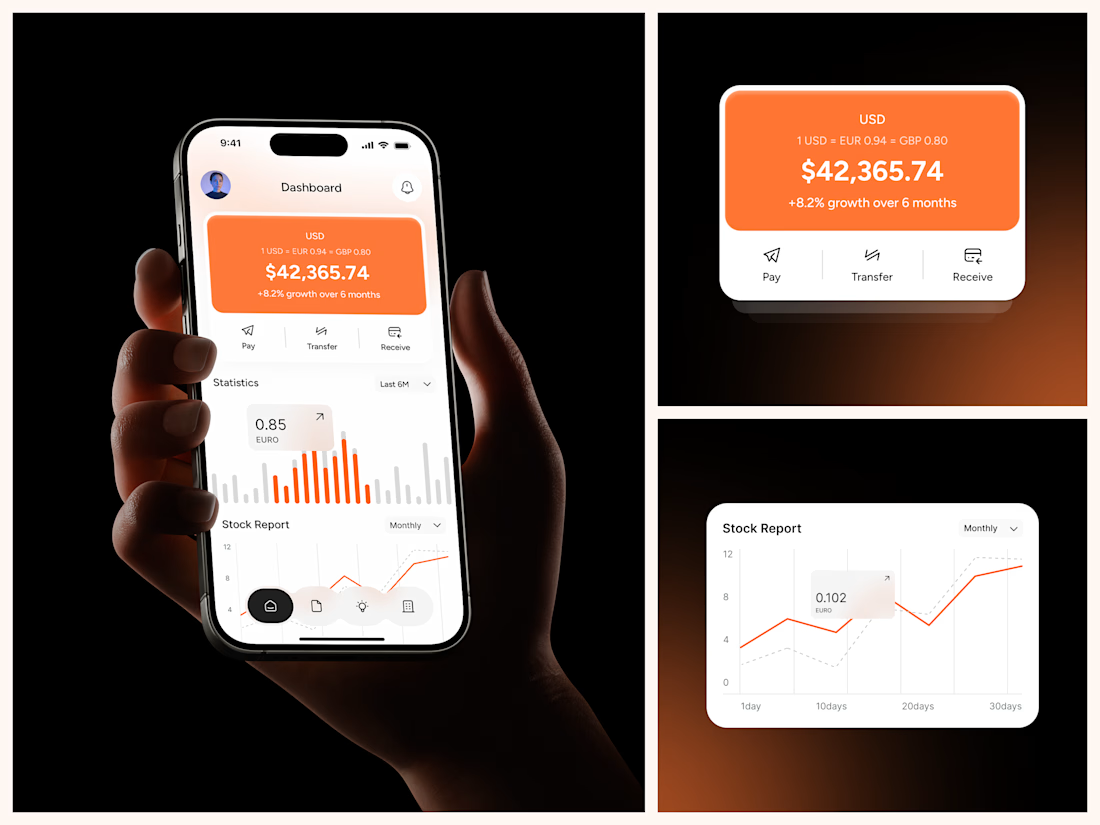

The coral red charts against the dark phone-in-hand shots make this pop, Rakesh. That Performance bar visual with the team collaboration section underneath gives the whole thing a real product feel. Clean mobile dashboard work.

Sunny Rock — Cinematic Paris Travel Website | Creative Web Development
Experience Paris through Sunny Rock, a cinematic travel website concept designed to combine immersive visuals, elegant UI/UX, and interactive scrolling into a premium digital experience.
This self-directed project explores modern web design through cinematic imagery, scroll-driven animations, glassmorphism, smooth transitions, and responsive layouts.
🛠️ Technologies & Skills
HTML5 & CSS3 — Semantic structure, modern styling, and responsive layouts
JavaScript (ES6+) / TypeScript — Interactive behavior and animation logic
React.js — Reusable components, hooks, and state management
Tailwind CSS — Utility-first styling and responsive design
HTML5 Canvas API — 2D rendering for visual effects and image sequences
Scroll-Driven Animation — Frame-by-frame image sequences synchronized with scrolling
requestAnimationFrame & Linear Interpolation (Lerp) — Smooth animation updates
Lenis Smooth Scrolling — Fluid scrolling experiences
Intersection Observer API — Scroll-triggered reveals and entrance animations
UI/UX & Visual Design — Visual hierarchy, typography, glassmorphism, and interaction design
SVG Graphics — Scalable icons and vector elements
AI Visual Generation & Prompt Engineering — Cinematic visual assets
Cloudinary — Media hosting and image optimization
Performance Optimization — Efficient asset loading and animation rendering
Python & Browser Automation — Development utilities, asset processing, and testing
✨ Design Highlights
Cinematic, immersive visual storytelling
Premium travel-inspired aesthetic
Smooth, scroll-based animation sequences
Modern glassmorphism interface
Responsive layouts for different screen sizes
Interactive elements and refined micro-interactions
Project Type: Self-Directed Portfolio Project
Focus Areas: Creative Front-End Development · Web Design · UI/UX Design · Interactive Experiences · Animation
Designed and developed by Ubaid | Ubaid Web Studio.🔥


