The network for creativity
Join 1.25M professional creatives like you
Connect with clients, get discovered, and run your business 100% commission-free
Creatives on Contra have earned over $150M and we are just getting started
Back to feedPost

Dynamic logo reveal built in After Effects. Optimized for modern UI/UX design using Lottie for fast, crisp web rendering.

Love this.

Niceee
The network for creativity
Join 1.25M professional creatives like you
Connect with clients, get discovered, and run your business 100% commission-free
Creatives on Contra have earned over $150M and we are just getting started
Related posts

New Reel for Brainrot!
Full project from Branding, to App Design to Animation and Illustration!
Dive in! Case study coming soon I swear!


This really bought a smile on my face. Love this

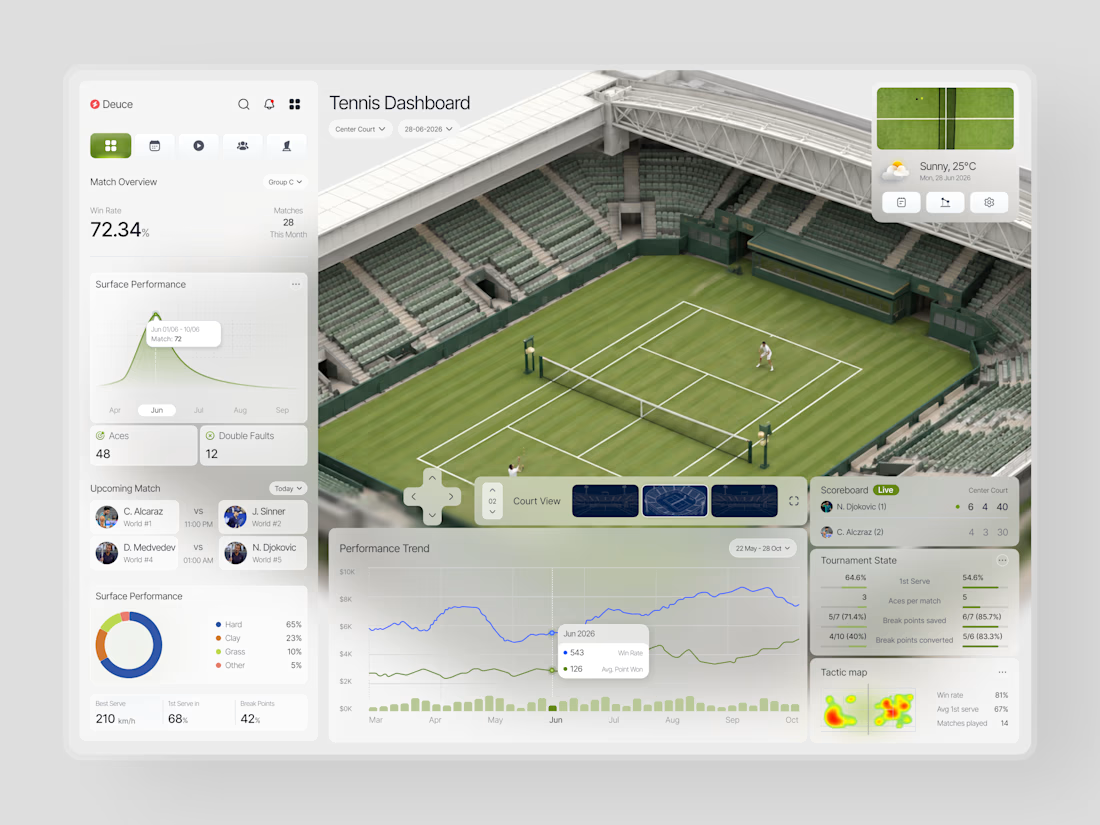
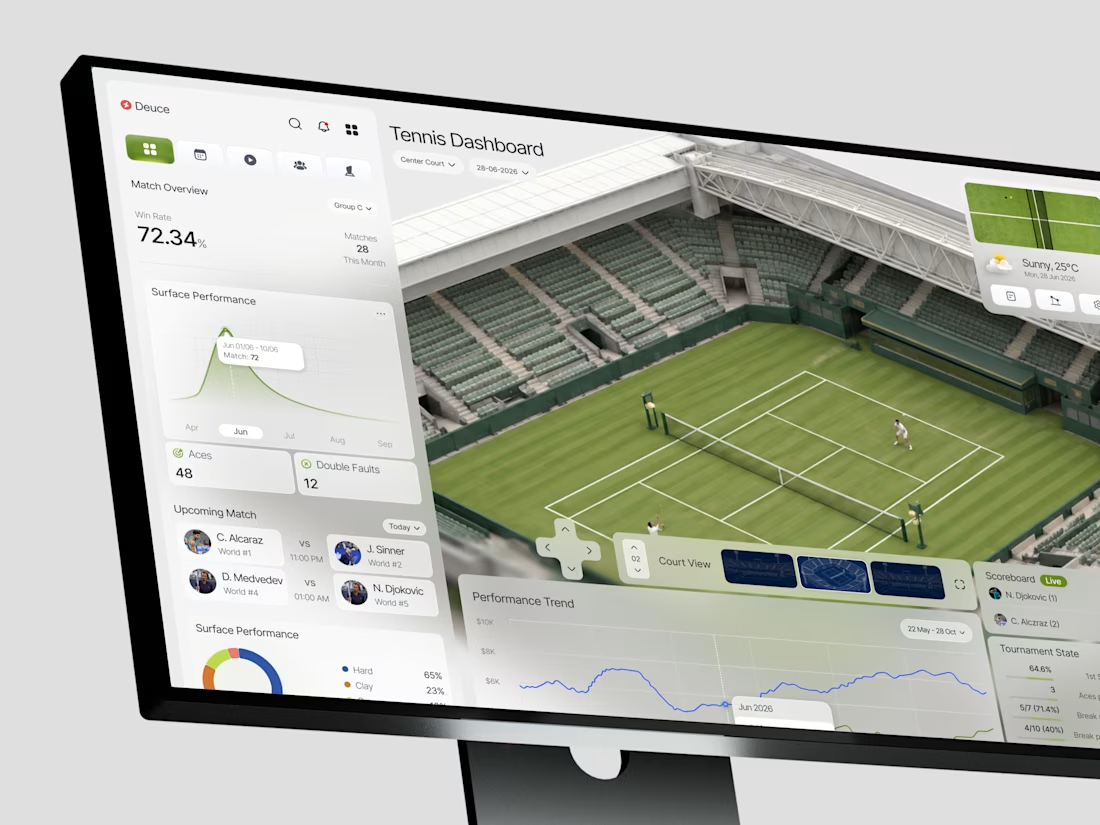
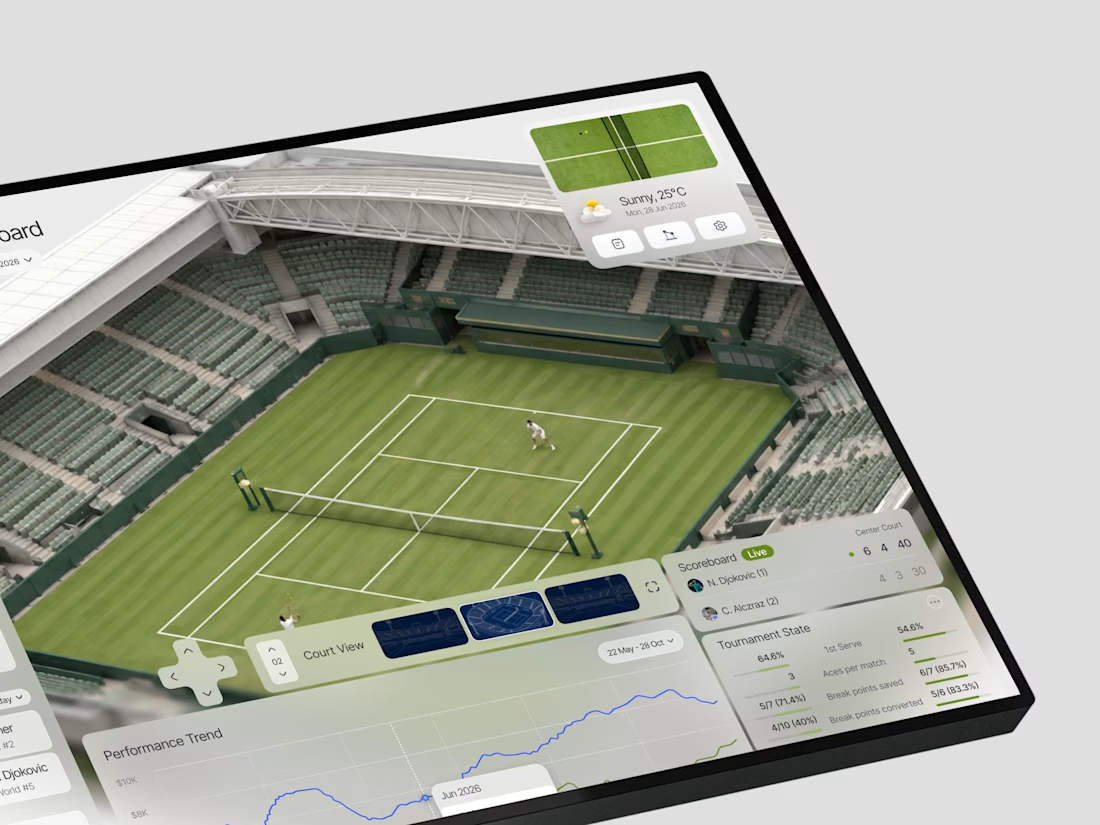
This is such a great example of turning complex data into a visual experience. 🎾🔥
Love how the court becomes part of the analytics instead of just sitting in the background. Really impressive work!

When does a sports dashboard need the court to be more than a background?
In this case, we were designing Deuce a tennis analytics platform that needed to make complex match data feel immediate and spatial, not just numerical.
The brief was clear: analysts and coaches don't just...

Page transitions on Heron are treated as view changes rather than document loads. Motion exits one page and continues into the next, with no hard reset and no white flash between states.
The reasoning is product-led. Heron runs inside Revit, Rhino, ArchiCAD and SketchUp, where switching context means panels updating around a drawing that stays put. A site built to sell that experience shouldn't behave like a set of separate files.
The transition also gives us somewhere to hide load time, which keeps the heavier interactive sections feeling immediate on slower connections.
Web DevelopmentuiuxdesignInteraction DesignArchitectureCreative Design Motion DesignBarba.jsWebflowWebGL








