The network for creativity
Join 1.25M professional creatives like you
Connect with clients, get discovered, and run your business 100% commission-free
Creatives on Contra have earned over $150M and we are just getting started
Back to feedPost

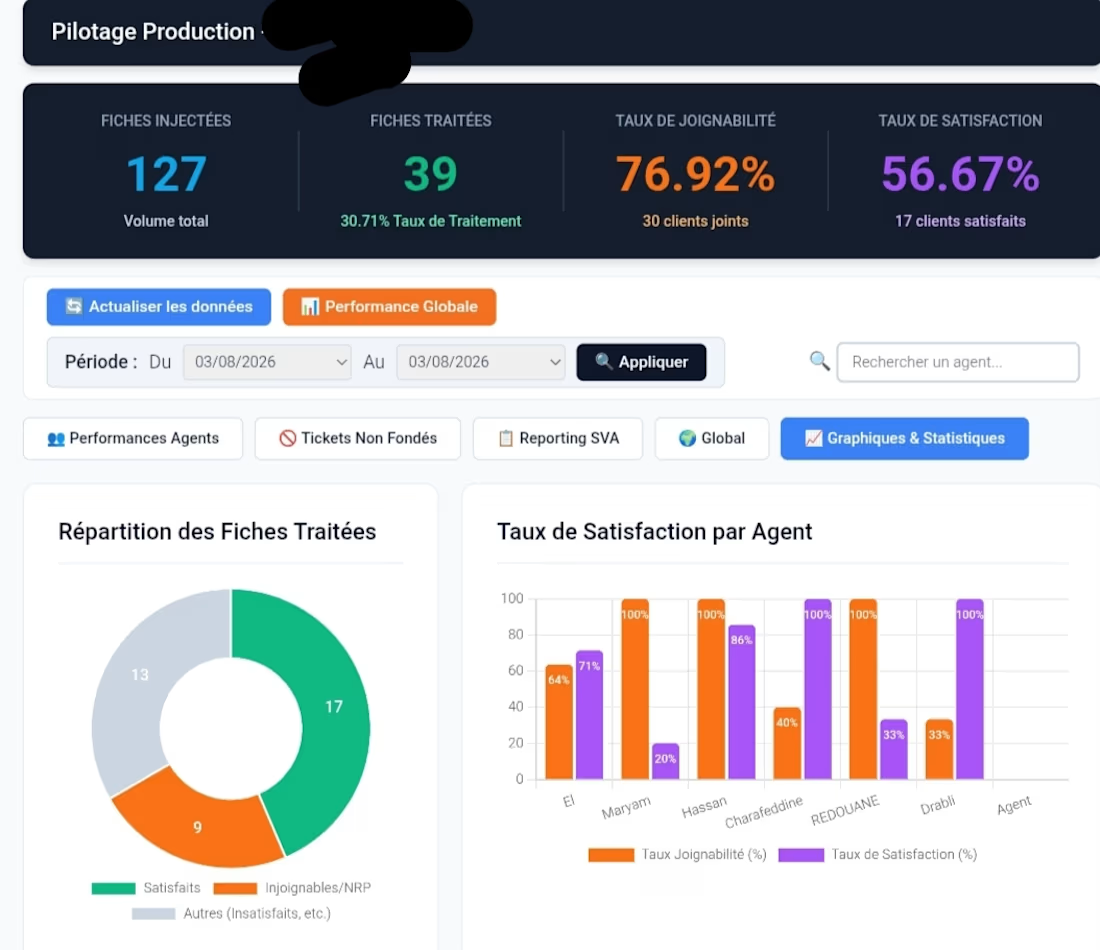
Project Title: Production Monitoring & KPI Tracking Dashboard
Project Description:
I designed and developed a custom analytical dashboard dedicated to production monitoring and performance tracking for a customer contact center. This interactive tool centralizes operational data and allows managers to track activity in real-time through a clear, dynamic interface.
Key Features:
Real-Time KPI Monitoring: Instant calculation and display of critical metrics (injected tickets, processed tickets, reachability rate, and customer satisfaction rate).
Advanced Data Visualization: Integration of dynamic charts (pie charts and bar graphs) to analyze processing status distribution and evaluate individual agent performance.
Custom Filtering & Reporting: Advanced sorting system by time period (dynamic calendar) and by agent, featuring dedicated tabs for detailed reports (e.g., Unfounded Tickets, VAS Reporting).
Impact:
This dashboard transformed data analysis for the management team. By replacing manual reporting with this automated tool, supervisors can now identify bottlenecks at a glance, provide targeted coaching to agents, and significantly optimize the overall quality of customer service.


The network for creativity
Join 1.25M professional creatives like you
Connect with clients, get discovered, and run your business 100% commission-free
Creatives on Contra have earned over $150M and we are just getting started











Related posts


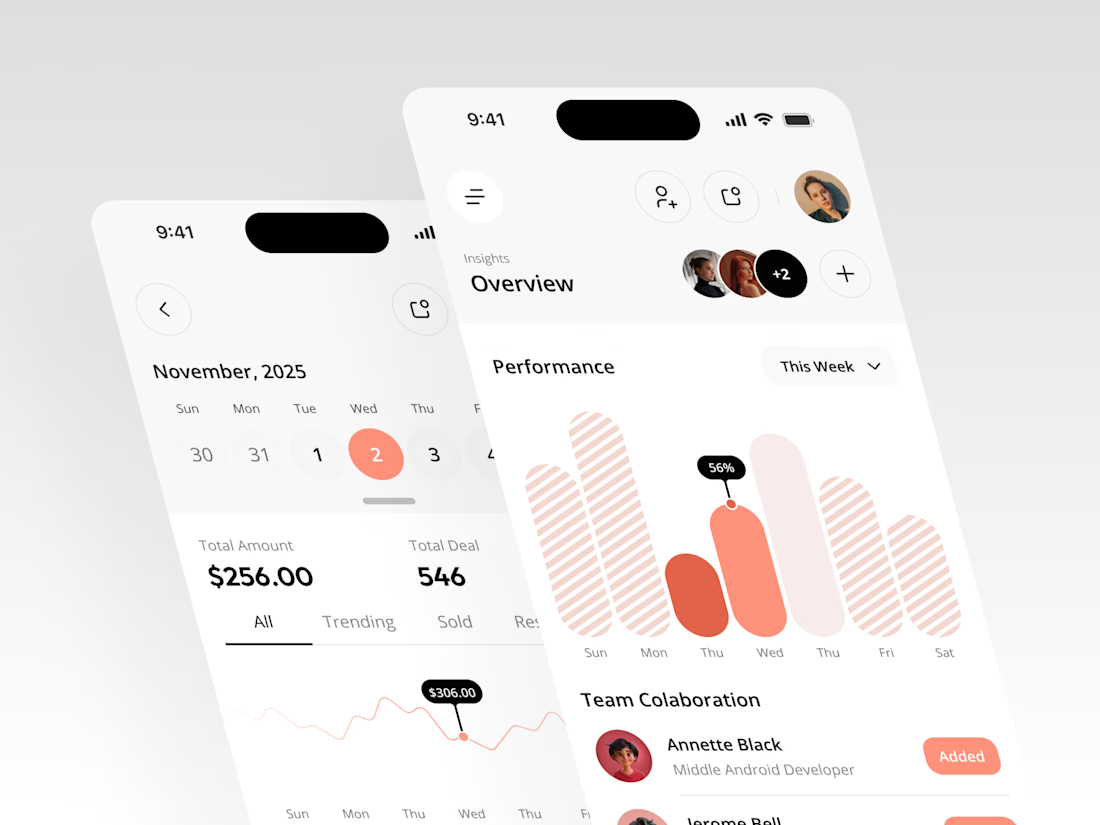
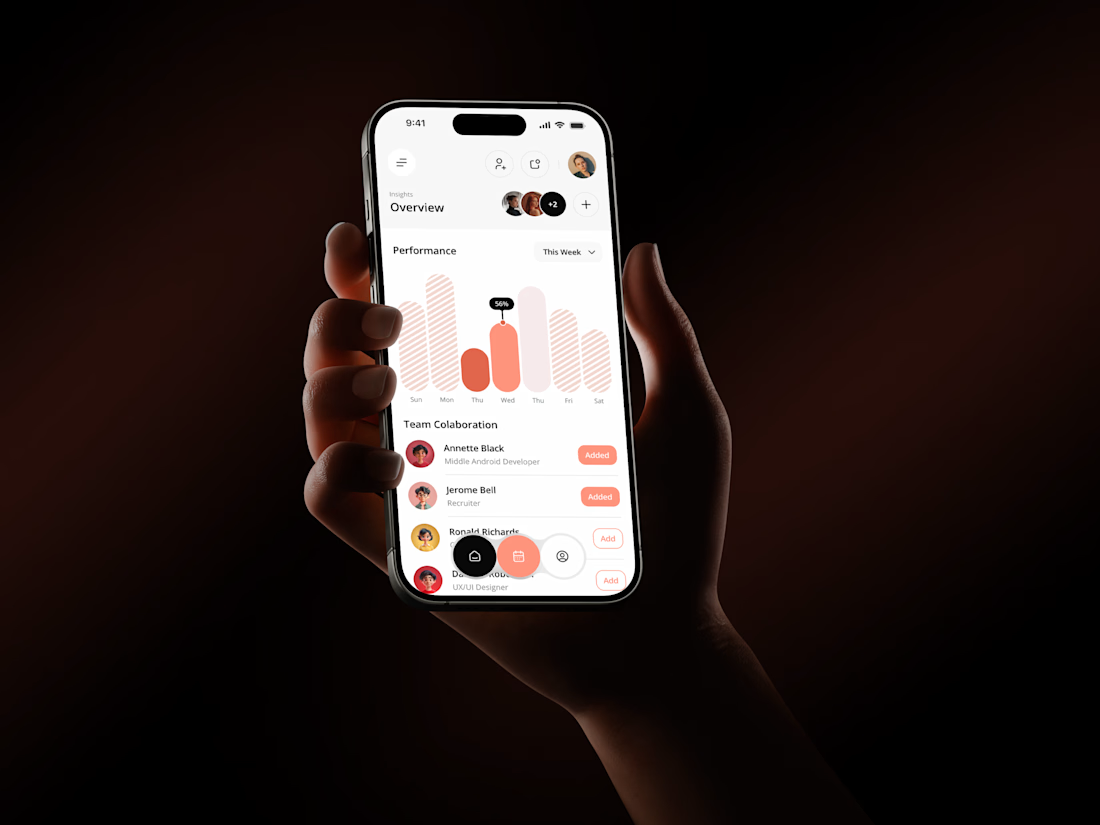
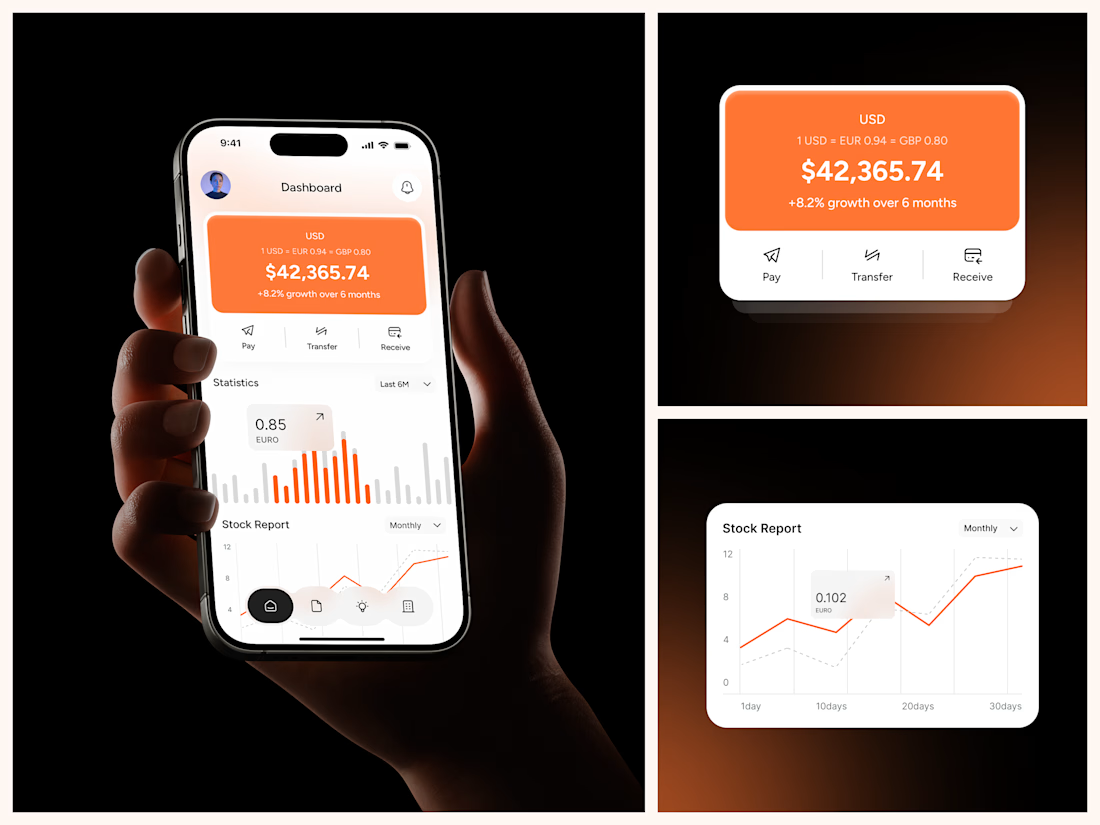

The coral red charts against the dark phone-in-hand shots make this pop, Rakesh. That Performance bar visual with the team collaboration section underneath gives the whole thing a real product feel. Clean mobile dashboard work.

Title / Headline:
Cubby — Smart Storage Service Web Design & Brand Identity
Description
Overview
Cubby is a modern, user-centric web platform concept built for smart storage and on-demand logistics solutions, designed to make space management seamless and visual.
Design Highlights:
Clean SaaS Aesthetics: Engineered an approachable, friendly layout utilizing soft white and pastel tones combined with vibrant 3D/isometric visual elements.
Typography & Layout Hierarchy: Paired bold sans-serif display typography with rounded sans body text for maximum clarity and user trust.
Interactive Service Flow ("How it works"): Structured step-by-step service visualization (Pack, Store, Deliver) to simplify complex logistics for users.
Brand Color & Mobile System: Developed a cohesive color palette (Ice Blue, Deep Navy, Sky Blue, Peach, and Sage) along with a fully optimized mobile-responsive interface.
Tools & Stack:
Figma, Adobe Illustrator, UI/UX Web Design, SaaS Design Systems, Mobile Responsive Layouts.


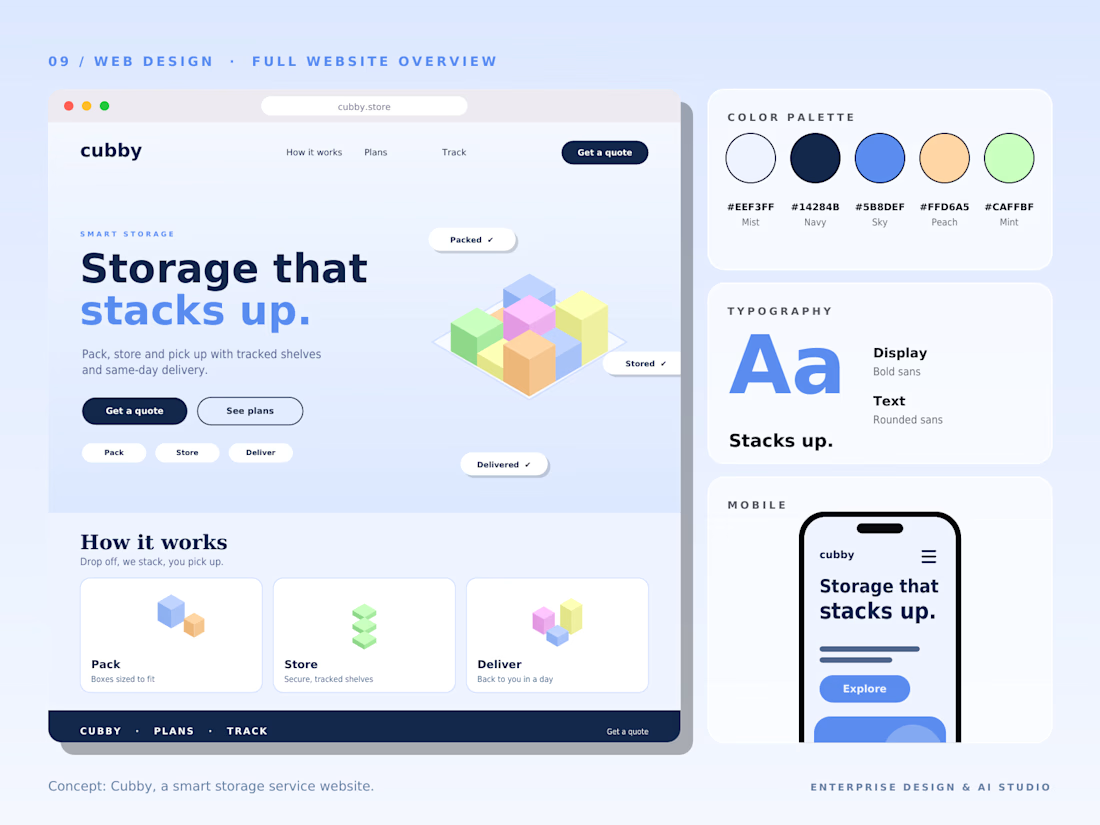
The Pack, Store, Deliver step flow is the smartest part of this. Storage logistics could feel dry, but the soft pastel palette and the isometric visuals make it feel friendly and approachable.

How I Built an End-to-End Sales Analytics Dashboard in Excel for an E-commerce Company
I recently completed an end-to-end sales analytics project using Microsoft Excel, transforming raw e-commerce sales data into an interactive dashboard that provides meaningful business insights.
In this project, I explored the data, performed analysis, identified key sales trends, and built an interactive dashboard to help businesses make data-driven decisions.
I documented the entire process, including the approach, tools, analysis, and dashboard development.
Read the full project walkthrough on Medium: https://medium.com/@Refino/how-i-built-an-end-to-end-sales-analytics-dashboard-in-excel-for-an-e-commerce-company-e8692d81f354


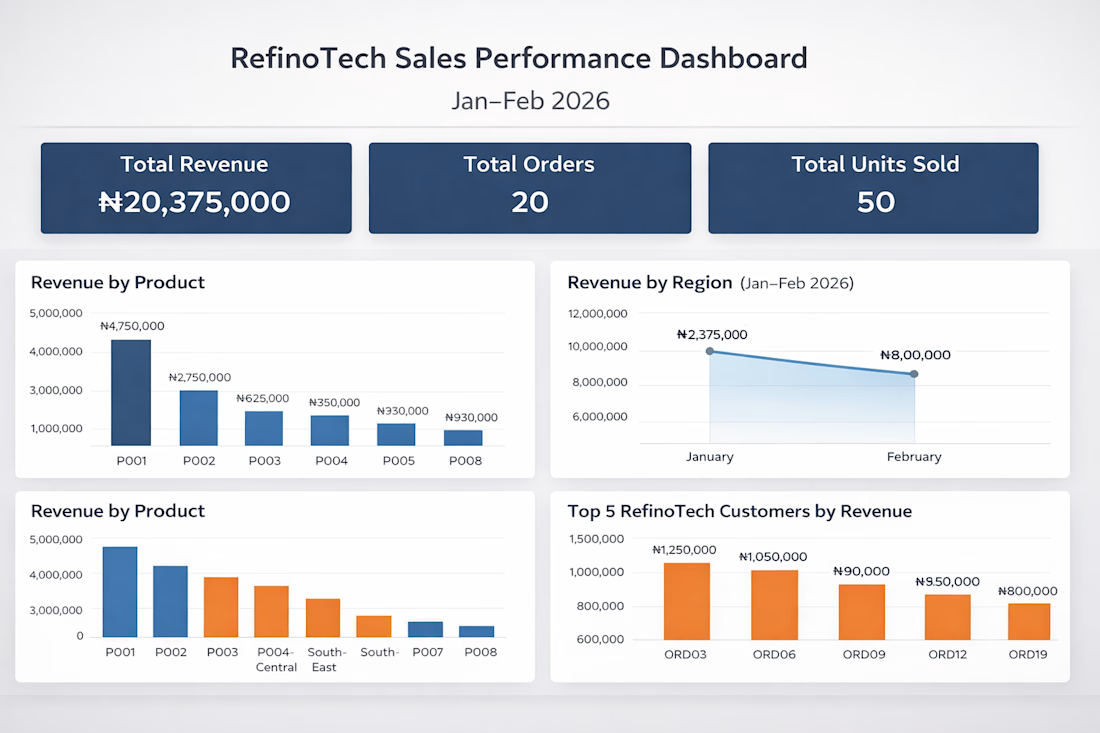

Excellent work! Turning raw data into actionable business insights is a valuable skill.