The network for creativity
Join 1.25M professional creatives like you
Connect with clients, get discovered, and run your business 100% commission-free
Creatives on Contra have earned over $150M and we are just getting started
Back to feedPost
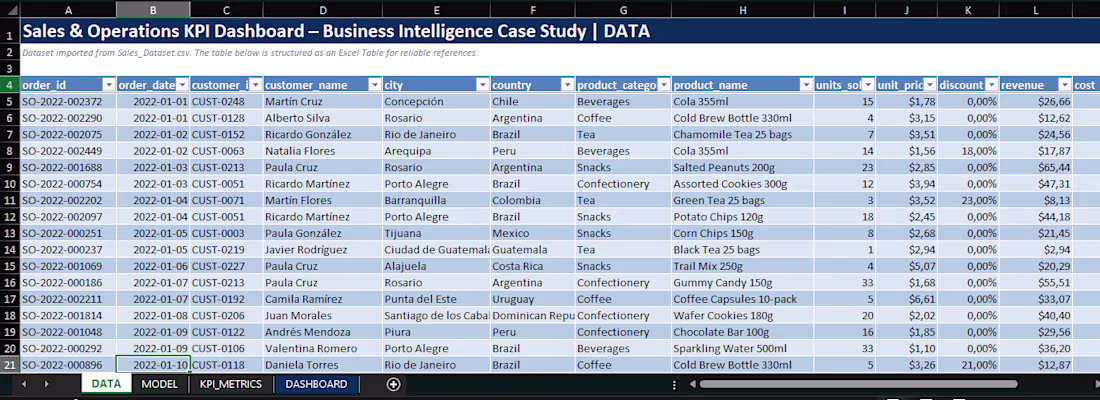
Built this Excel-based Sales & Operations KPI Dashboard to turn raw data into a clean, decision-ready executive reporting system.
What’s included:
• structured raw data layer
• calculation/model sheet
• KPI summary layer
• dashboard with revenue and category insights
This type of workflow is useful for teams that still manage reporting manually and need faster decision visibility.
I usually focus on:
Excel reporting automation
KPI dashboards
data cleaning & structuring
workflow optimization
Open to similar projects.
If anyone is working with manual Excel reporting and wants to automate it, happy to share ideas or approaches.
The network for creativity
Join 1.25M professional creatives like you
Connect with clients, get discovered, and run your business 100% commission-free
Creatives on Contra have earned over $150M and we are just getting started
Related posts
What if your spreadsheets could think?
Meet Prisme — the no-code BI tool that turns raw data into live, shareable dashboards. No SQL. No dev needed. Just your data, finally alive. 🟧🟦


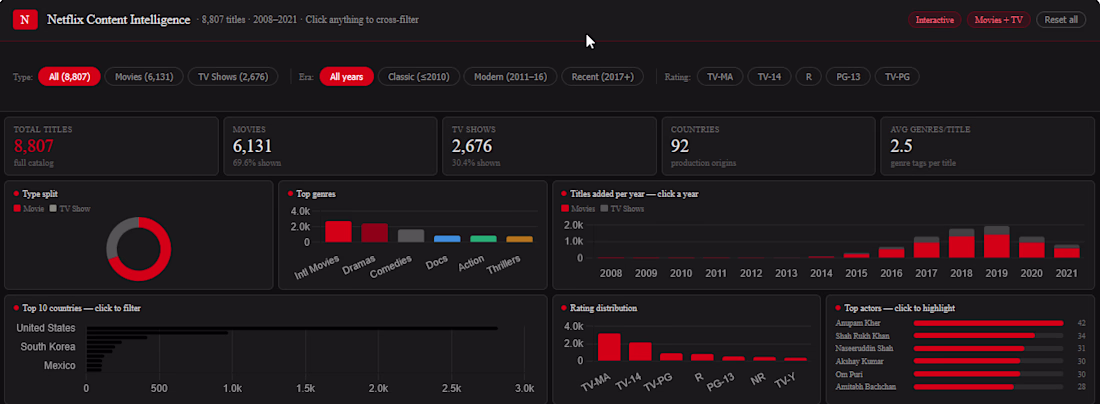
Netflix Content Intelligence Dashboard
Great, if I may ask about the stack?
A modern real estate management experience designed to make property operations feel clear, premium, and effortless. Built for agencies and property teams handling listings, analytics, appointments, and sales in one unified workspace.
Designed in Figma with a soft neutral interface, bold contrast system, and spacious modular layout that keeps complex property data easy to scan. The dashboard combines performance analytics, interactive property cards, listing management tables, and integrated map tracking into a workflow that feels both elegant and highly functional.
The real strength of the system is flexibility. The same structure can easily adapt for luxury real estate, rental management, hospitality platforms, or property investment tools. From the large visual property showcase to the compact analytics widgets, every section was designed to balance clarity with premium visual presentation.
Really happy with how the monochrome palette and clean spacing helped create a calm, high-end dashboard experience without sacrificing usability.
Would love to hear your thoughts on the UI direction. 👀
UX Design | Real Estate | Dashboard UI | SaaS Platform
Tools: Figma, Jitter
Rock solid layout! 🤘
Trending
Claude
Claude has entered the design space. How are you using Claude Design?
Contra University
Learn from expert creatives how to earn more using next-gen AI tools.
creativeaiflow
Creative AI workflows are evolving. What tools do you use, and what are their strengths and weaknesses?
portfolioreview
The best portfolios tell a story, not just show a grid. Share yours for feedback.
freelancerlife
Freelancer life is wins, pivots, and everything in between. What’s yours right now?