The network for creativity
Join 1.25M professional creatives like you
Connect with clients, get discovered, and run your business 100% commission-free
Creatives on Contra have earned over $150M and we are just getting started
Back to feedPost
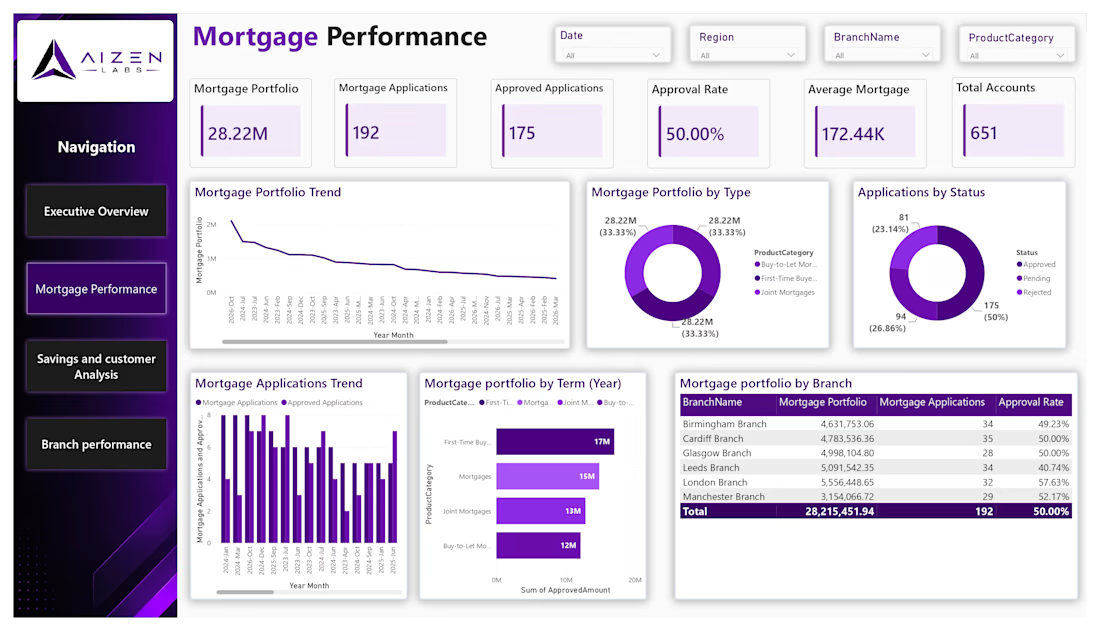
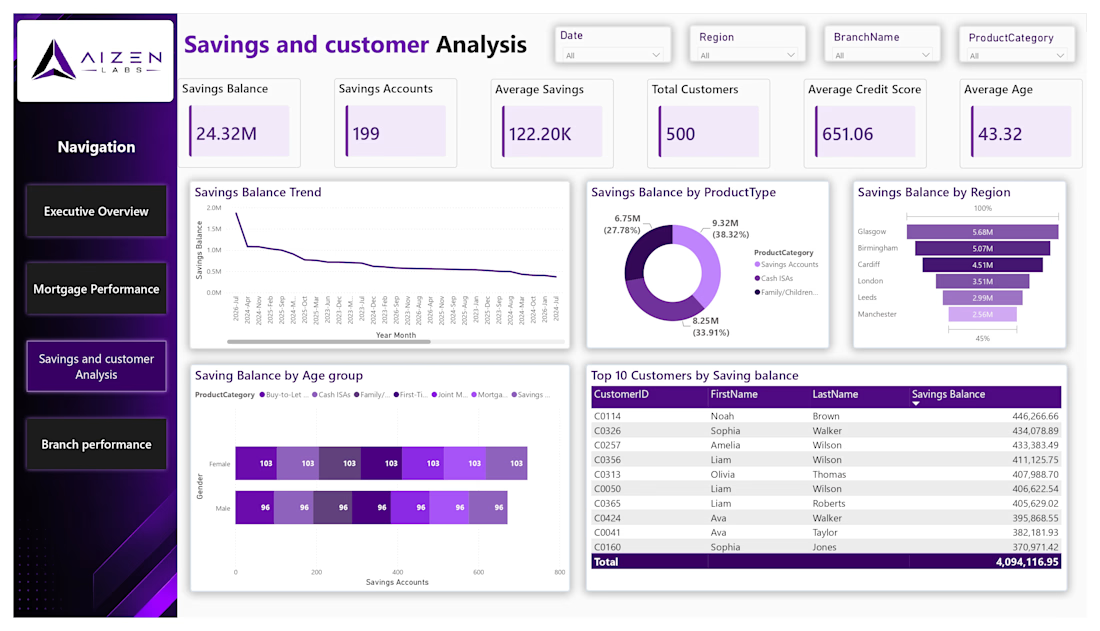
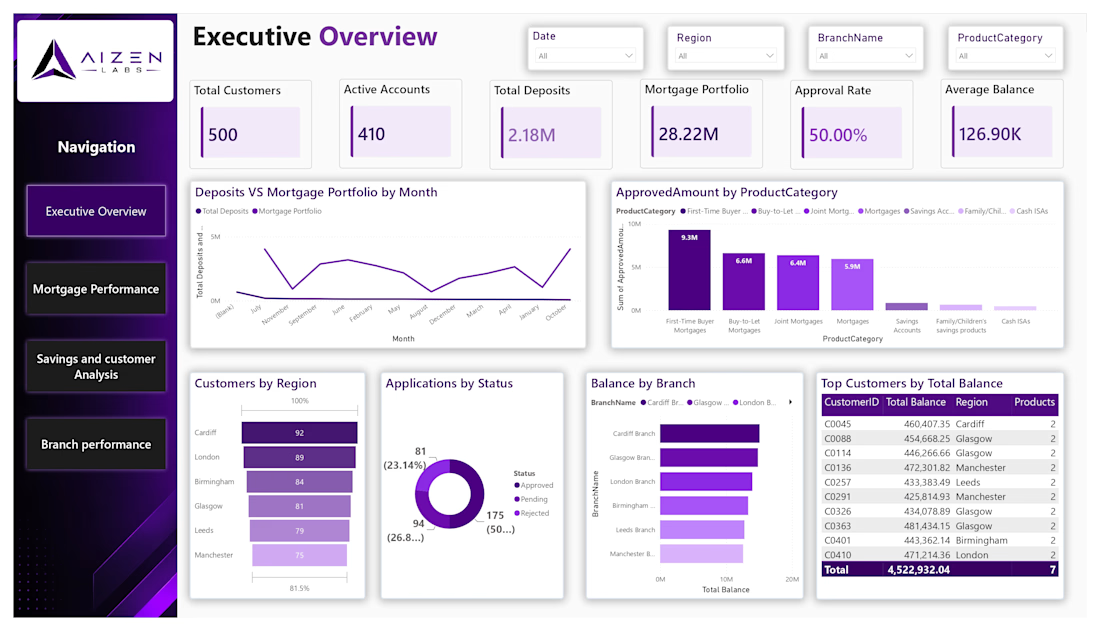
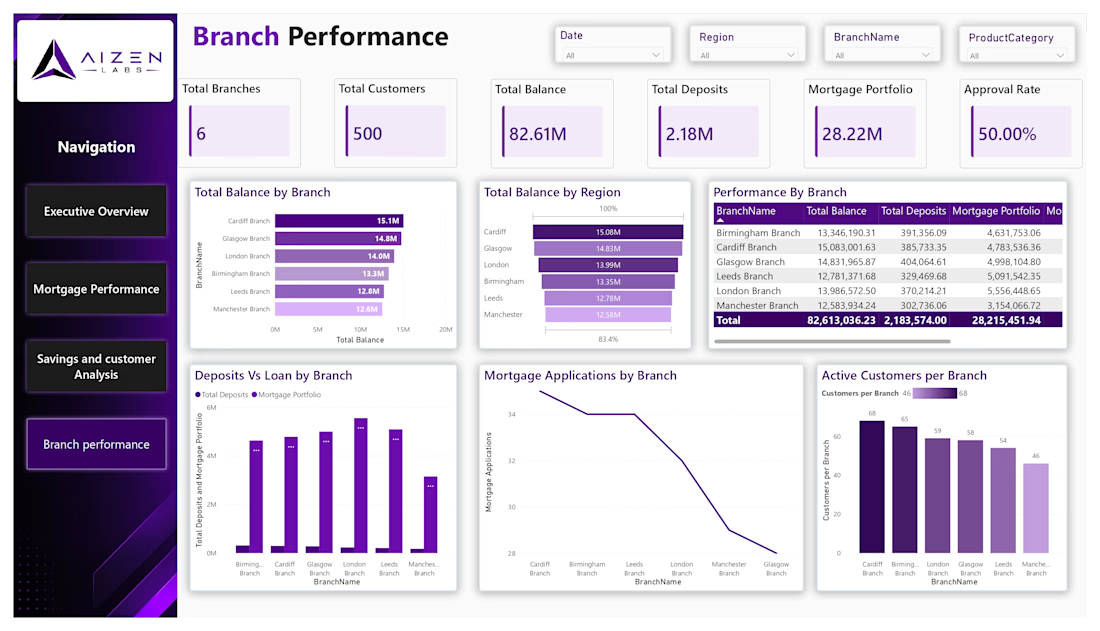
The Banking & Financial Performance Dashboard is an interactive Power BI reporting solution designed to help financial institutions monitor financial performance, analyze customer activity, and gain insights into banking operations.
The dashboard consolidates financial data into a centralized reporting environment, allowing users to track key performance indicators, analyze revenue and expenses, monitor banking trends, and compare performance across different periods.
Through interactive visualizations, KPI cards, and detailed reports, management can explore financial data and make informed business decisions.
Key Features
1. Financial Performance Analysis
Revenue and profitability monitoring.
Income and expense analysis.
Financial performance comparisons across periods.
Actual vs. budget analysis.
Monthly, quarterly, and yearly financial trends.
2. Banking Operations Analysis
Deposit and loan portfolio analysis.
Banking transaction performance.
Customer activity and account analysis.
Financial product performance.
Operational trend monitoring.
3. Customer & Portfolio Insights
Customer segmentation and performance analysis.
Loan and deposit distribution.
Financial product usage patterns.
Customer contribution to financial performance.
4. Interactive Reporting
KPI cards for key financial metrics.
Dynamic charts and detailed tables.
Interactive filters for financial periods and business categories.
Comparative analysis to support management reporting.
Business Value
The dashboard provides a consolidated view of banking and financial performance, helping management monitor financial indicators, understand portfolio trends, evaluate business performance, and identify areas requiring further analysis.
Technologies Used
Microsoft Power BI | DAX | Power Query | Data Modeling | Financial Analytics | Banking Analytics | Business Intelligence

The network for creativity
Join 1.25M professional creatives like you
Connect with clients, get discovered, and run your business 100% commission-free
Creatives on Contra have earned over $150M and we are just getting started







Related posts

Which dashboard works better for an Occupational therapist?

2 voted
40%
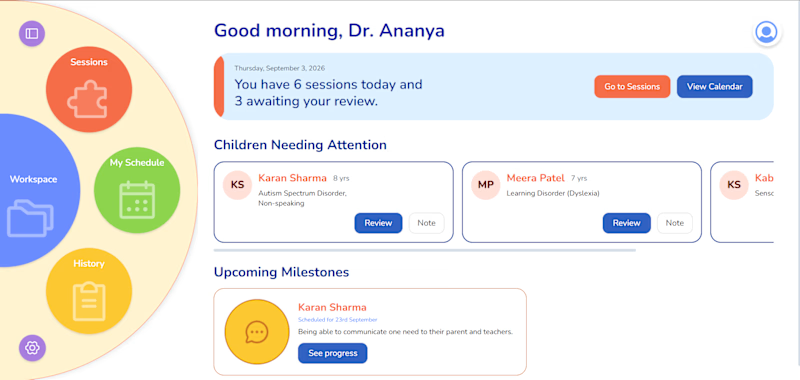
3 voted
60%
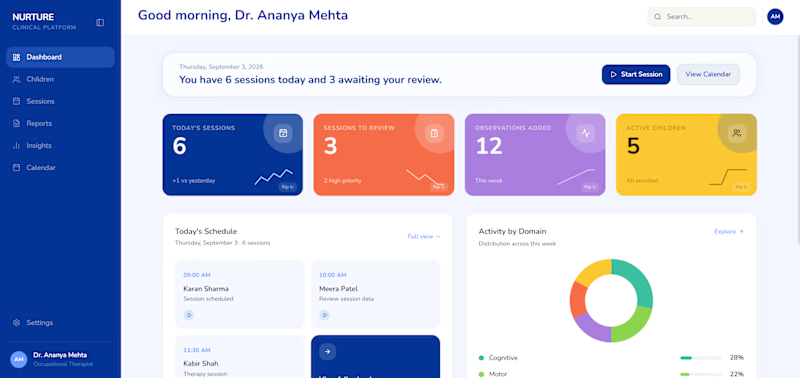
5 votes
Closed

Dashboard should be for how much data can be scanned in the shortest time possible.
Bright Colors are distraction here.

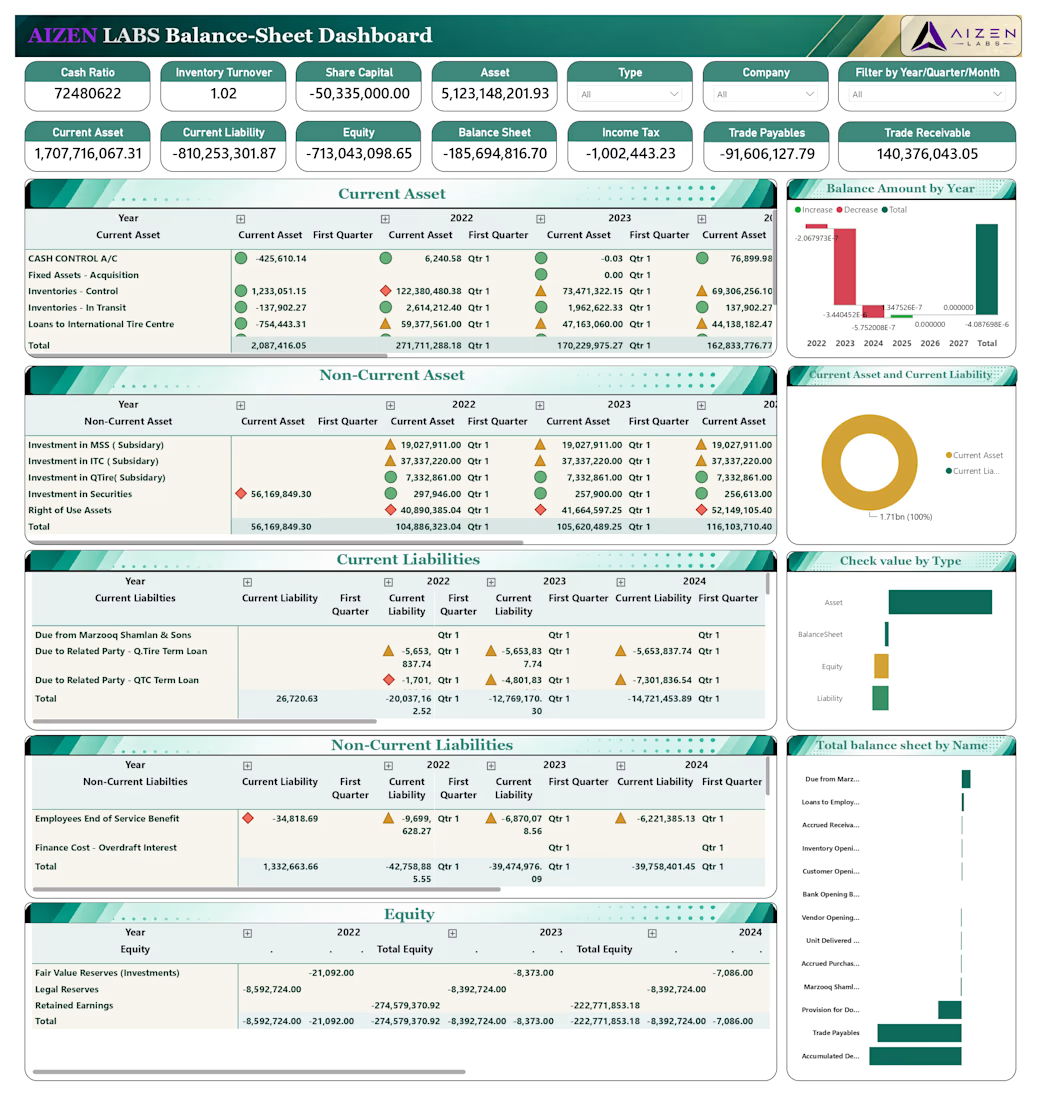
The Balance Sheet Analysis Dashboard is an interactive Power BI reporting solution designed to provide a comprehensive view of an organization's financial position.
The dashboard consolidates balance sheet data into a centralized reporting environment, enabling finance teams and management to monitor assets, liabilities, and shareholders' equity while analyzing financial stability and changes in the company's financial position over time.
Through interactive KPI cards, financial breakdowns, and period-based comparisons, users can explore financial data and gain insights into the organization's financial structure.

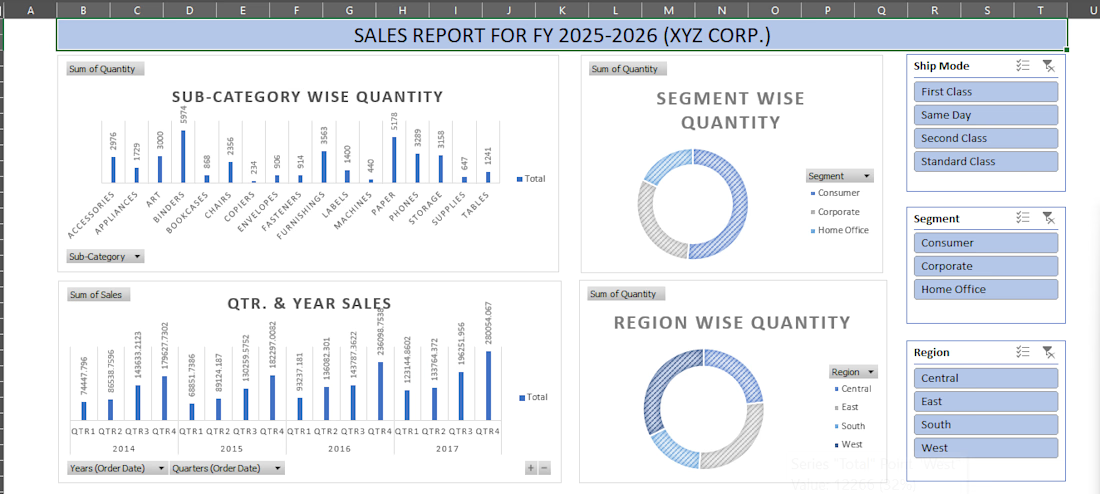
XYZ Corp. Sales Performance Dashboard
Created an interactive Excel dashboard to analyze FY 2025–2026 sales data and present key performance insights through KPIs and visual summaries.
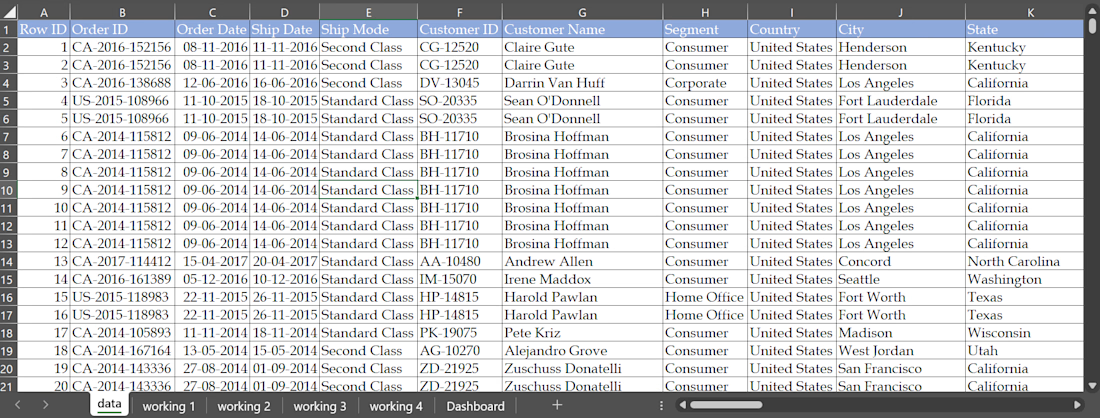
Excel features used: Pivot Tables, Pivot Charts, Slicers, Formulas, Data Cleaning, and Dashboard Design.
The dashboard transforms raw sales data into a clear, interactive view, making it easier to track and understand overall sales performance.