The network for creativity
Join 1.25M professional creatives like you
Connect with clients, get discovered, and run your business 100% commission-free
Creatives on Contra have earned over $150M and we are just getting started
Back to feedPost

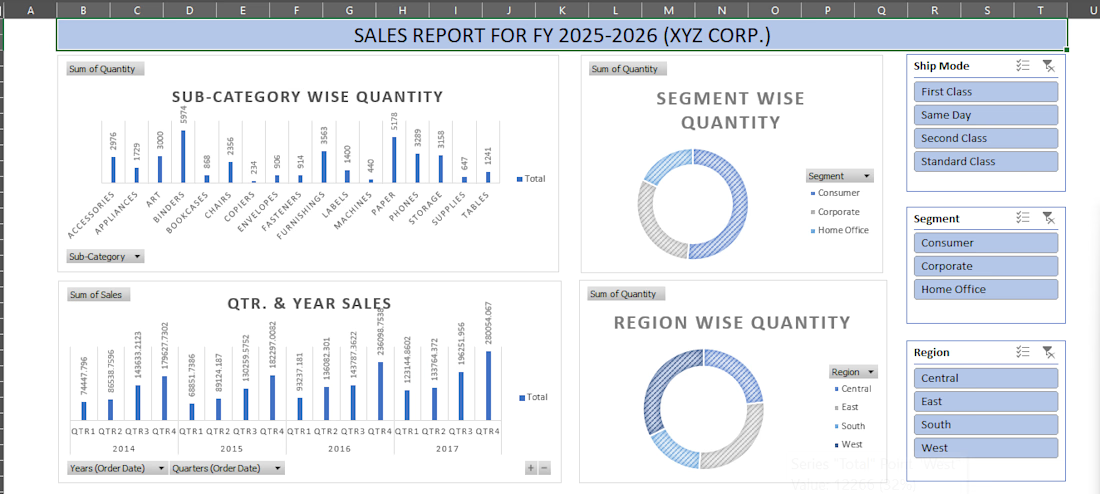
XYZ Corp. Sales Performance Dashboard
Created an interactive Excel dashboard to analyze FY 2025–2026 sales data and present key performance insights through KPIs and visual summaries.
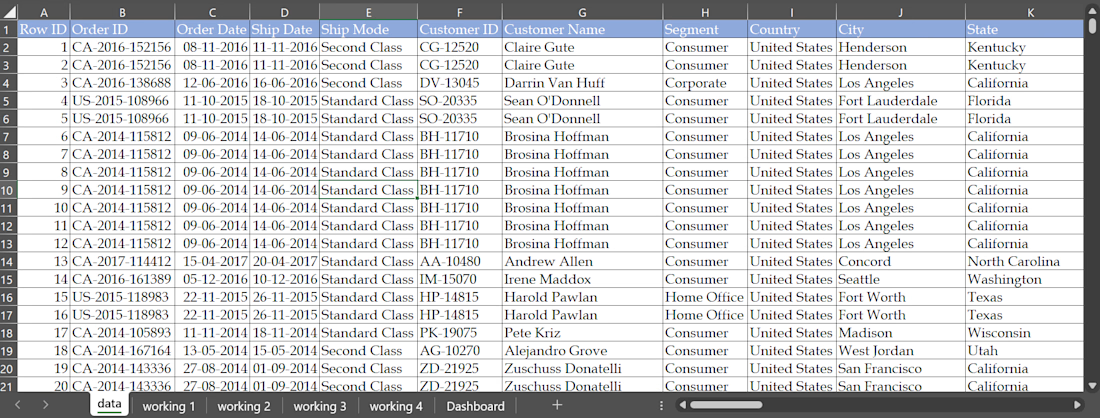
Excel features used: Pivot Tables, Pivot Charts, Slicers, Formulas, Data Cleaning, and Dashboard Design.
The dashboard transforms raw sales data into a clear, interactive view, making it easier to track and understand overall sales performance.

The network for creativity
Join 1.25M professional creatives like you
Connect with clients, get discovered, and run your business 100% commission-free
Creatives on Contra have earned over $150M and we are just getting started







Related posts

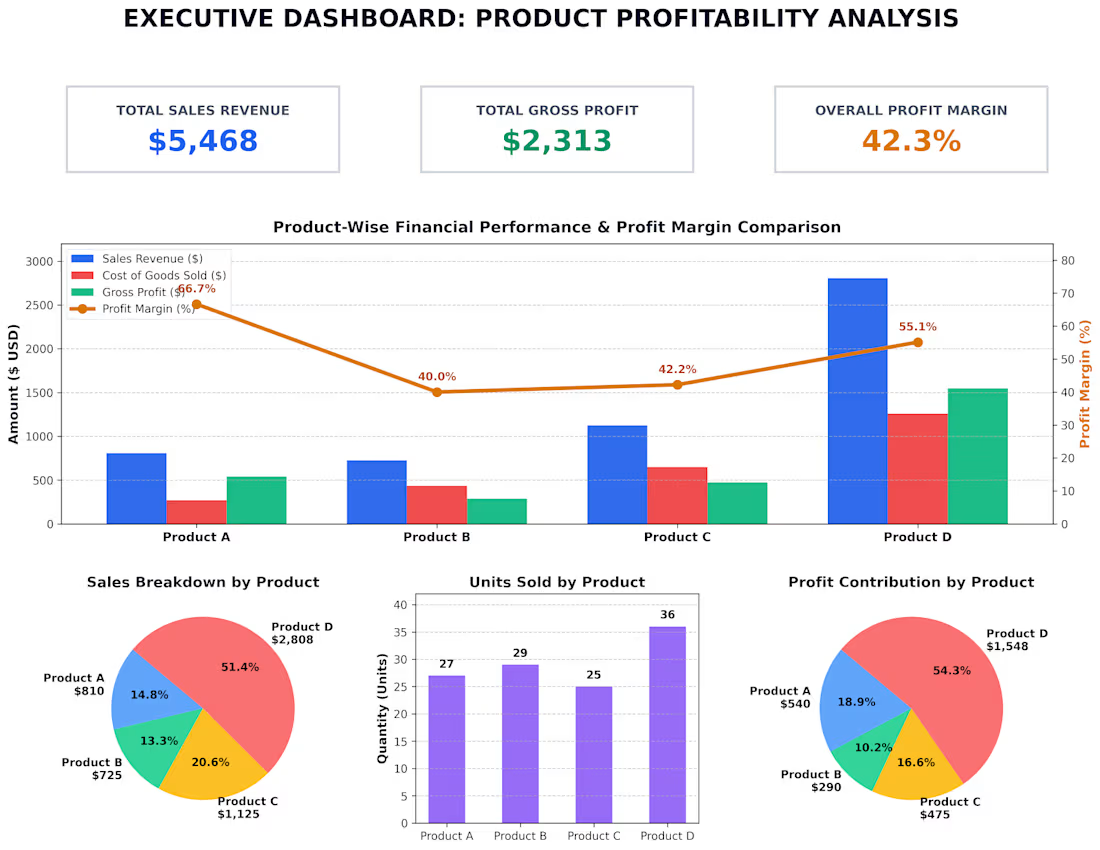
Dashboard Key Highlights:
Total Performance: Total Revenue of $5,468 and Gross Profit of $2,313 with an overall profit margin of 42.3%.
Top Profit Contributor: Product D yields the highest gross profit at $1,548 (54.3% of total profit) and revenue of $2,808 (51.4% of total sales).
Highest Margin Product: Product A leads in efficiency with a 66.7% profit margin ($540 profit on $810 sales).


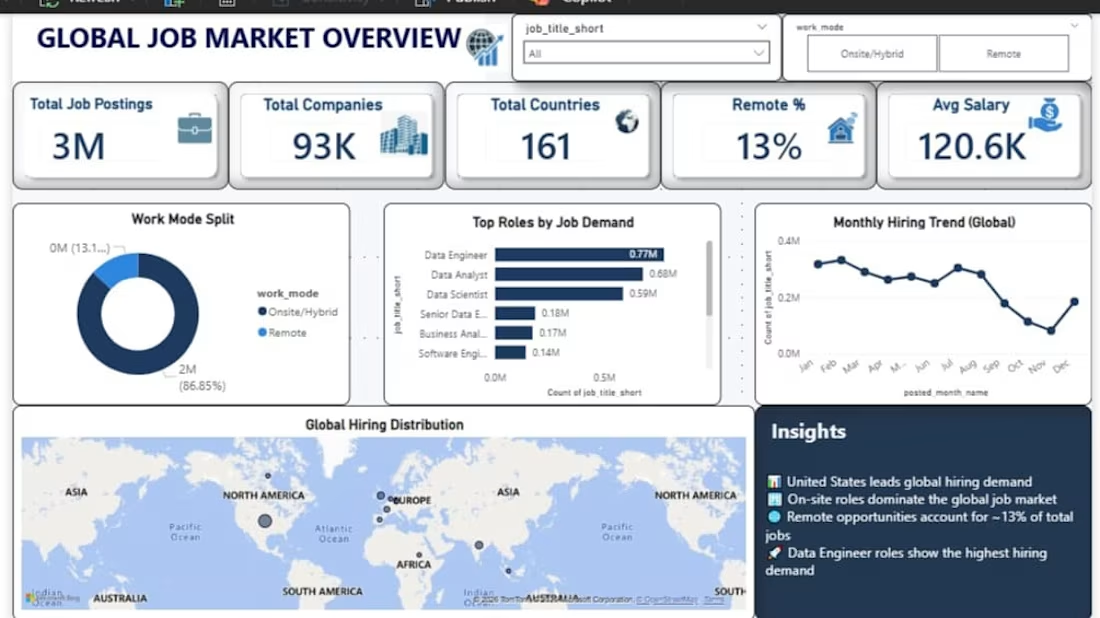
I analyzed 3M+ job postings across 161 countries and 93K companies to identify hiring trends, in-demand roles, work-mode patterns, and salary insights.
I used Python for data cleaning and preprocessing, SQL for analysis, and Power BI to build an interactive dashboard.
Key areas analyzed:
• Global hiring demand
• Top job roles by demand
• Remote vs. onsite/hybrid work patterns
• Average salary trends
• Monthly hiring trends
This project helped me turn a large dataset into clear, actionable insights for understanding the global job market.



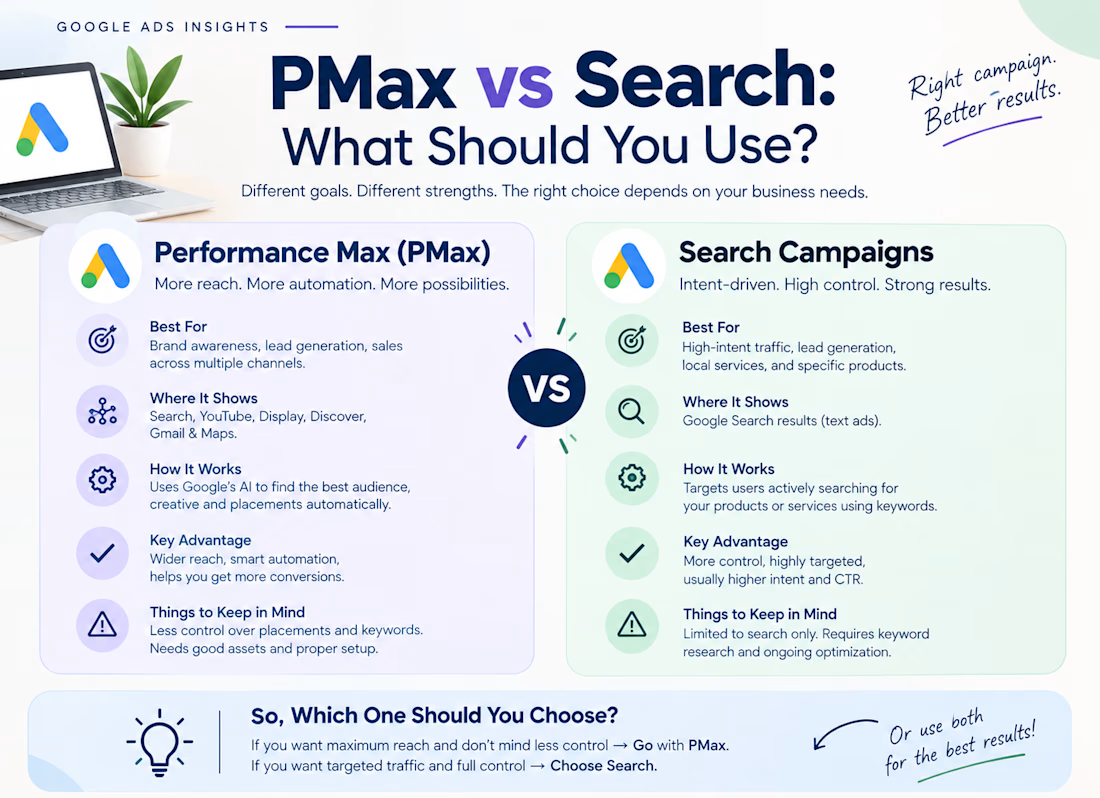
🚀 PMax vs Search: What Should You Use?
A common question I hear:
“Should I run Performance Max or Search campaigns?”
The answer depends on your business goal, audience, and campaign data.
🔎 Search Ads
Best when you want to target people actively searching for specific products or services.
✅ More control over keywords
✅ Strong search intent
✅ Useful for capturing demand
✅ Easier to understand search-based performance
🤖 Performance Max
Best when you want Google to use automation across multiple Google channels and optimize toward your conversion goals.
✅ Automated bidding & targeting
✅ Access to multiple Google placements
✅ Useful for eCommerce and conversion-focused campaigns
✅ Can help scale when you have enough quality conversion data
💡 The key isn't choosing one simply because it's popular.
Start with your business objective, conversion tracking, budget, and available data—then choose the campaign structure that fits.
Don’t choose the campaign type first. Choose the strategy first.
📩 Need help planning or optimizing your Google Ads campaigns? Let’s connect.
#GoogleAds #PerformanceMax #PMax #SearchAds #GoogleAdvertising #PPC #DigitalMarketing #AdOptimization #PerformanceMarketing