The network for creativity
Join 1.25M professional creatives like you
Connect with clients, get discovered, and run your business 100% commission-free
Creatives on Contra have earned over $150M and we are just getting started
Back to feedPost
I’m for anyone looking at these projects , they have proved to be
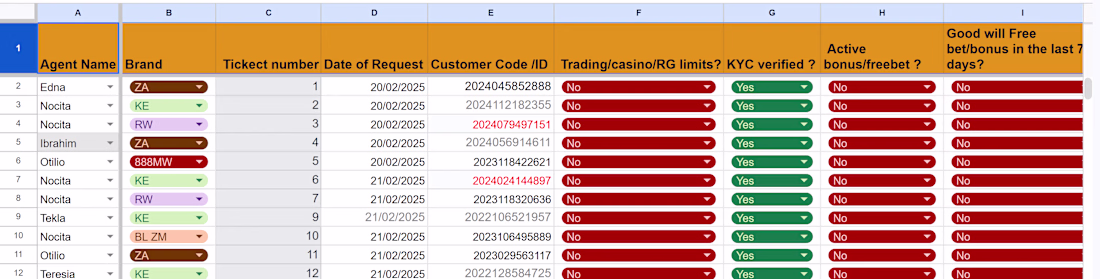
1: Bonus tracker 📊 – I have built online spreadsheets for customer support to record customers who are asking for goodwill bonuses.
What is in it?
The spreadsheet has two sheets: one for customer support and the second for the operations team, who are responsible for adding the bonuses. The CS sheet includes columns such as the name of the CS agent, incident ticket number, customer ID, and criteria for bonus qualification. Once CS fills in those criteria using the drop-down filter, the last tab indicates whether the customer qualifies or not. If the customer qualifies, the customer information is automatically passed to the second sheet (this process is automated), allowing the responsible team to credit the customer without needing to verify on the customer support sheet.
Why is it useful?
This type of project can be used for customer retention (it was created for a betting company and delivered good results) and can also be applied to the KYC process, where a team can request customer information and record it in one place.
It helps reduce manual verification, improves turnaround time for bonus allocation, and ensures consistency in decision-making across teams.
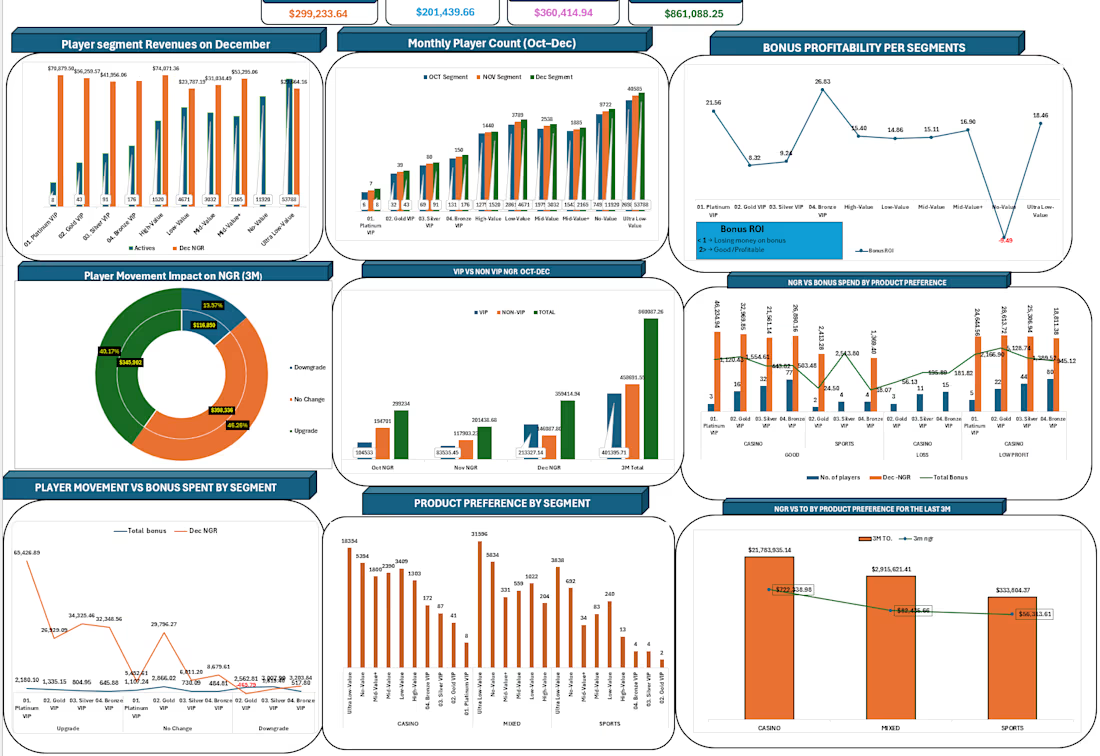
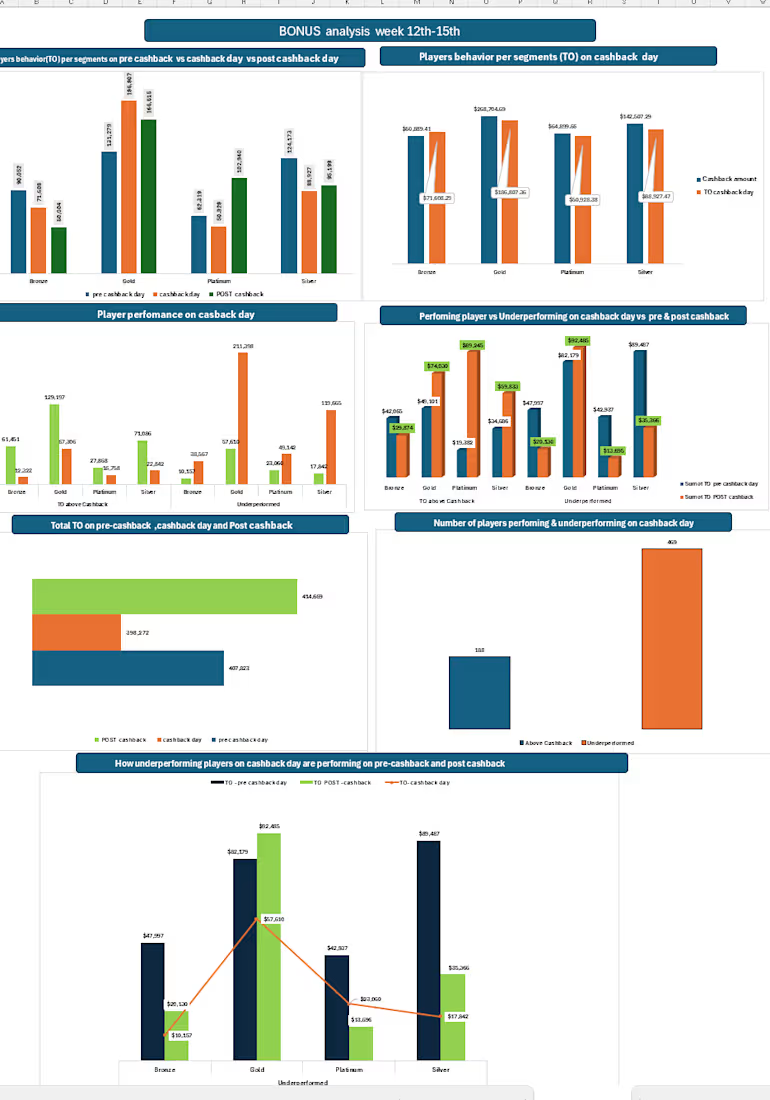
2. KPIs Analysis 📈 – I have also worked on a project where I analyzed the performance of key business KPIs. For example, in a betting company, I worked on KPIs such as Registration, First Time Depositors (FTDs), Turnover, Bonuses, and Net Gaming Revenue (NGR).
What is in it?
The image shows dashboard visualizations of the main KPIs and how they evolve over time, providing a complete picture to support decision-making.
Why is it useful?
This type of analysis helps improve business performance as it acts as a Strengths, Weaknesses, Opportunities, and Threats (SWOT) overview. It provides a clear understanding of the business and supports making the right decisions at the right time. The same approach can also be used for competitor analysis. Depending on the need, it can be done weekly, monthly, or yearly for better results.
It enables faster identification of trends, highlights performance gaps, and supports data-driven decision-making.
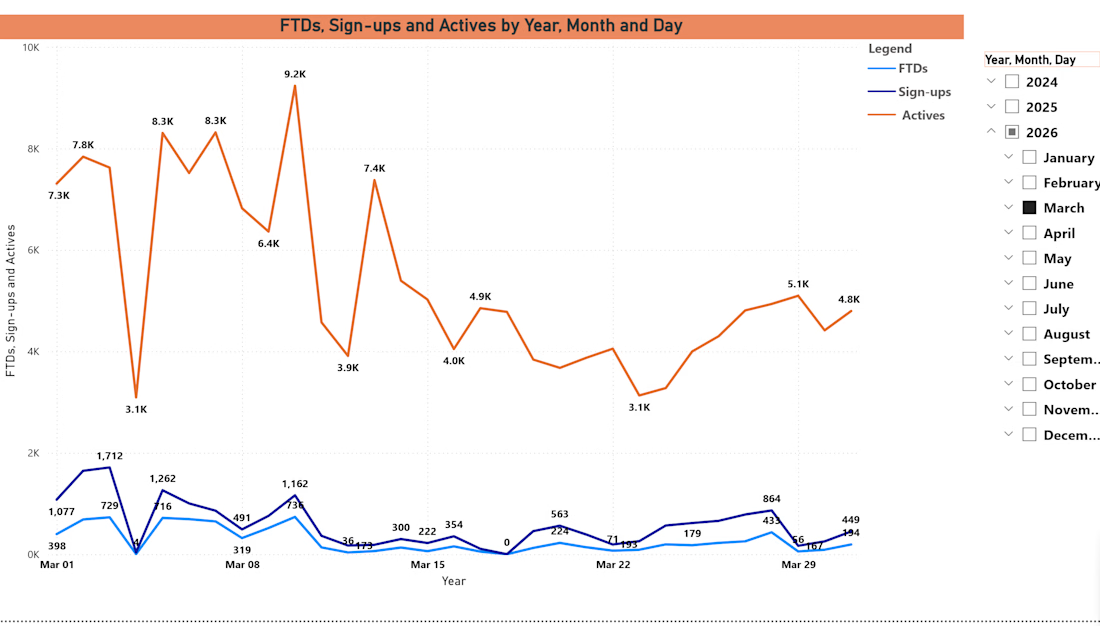
3. Daily KPIs monitoring/tracking ⚡ – I have implemented this using Power BI, as it is a powerful tool for daily tracking and comparisons. With clear visualizations, it allows monitoring of different KPIs, such as sales per product, and comparing them with previous days or using them to plan future performance.
This improves visibility of daily performance, helps detect issues early, and supports quicker operational decisions.
For anyone reviewing these projects, they have proven to be effective in improving business operations and supporting better decision-making. I am available to work with you and support similar projects or what you have, based on your business needs
The network for creativity
Join 1.25M professional creatives like you
Connect with clients, get discovered, and run your business 100% commission-free
Creatives on Contra have earned over $150M and we are just getting started
Related posts
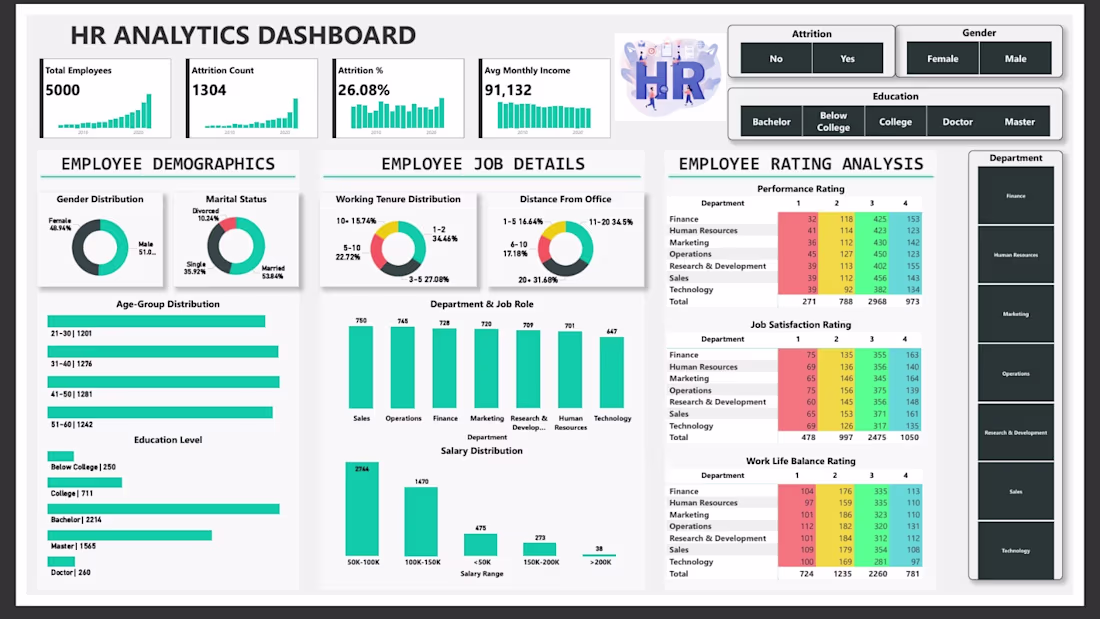
👥 HR Analytics Dashboard
Overview
A comprehensive HR analytics solution built with Power BI to analyze employee attrition, performance metrics, and workforce demographics. This project provides actionable insights for talent retention strategies and organizational decision-making.
🎯 Key Features
Employee Demographics Analysis: Gender, age groups, marital status, and education distribution
Attrition Intelligence: 26.08% attrition rate analysis with predictive indicators
Performance Metrics: Department-wise ratings and job satisfaction scores
Compensation Analysis: Salary distribution and income benchmarking
Work-Life Balance Insights: Distance from office and tenure correlations
📊 Dashboard Highlights
5,000 total employees analyzed
1,304 attrition cases identified
₹91,132 average monthly income
Interactive filtering by department, gender, and education
Multi-dimensional performance rating system
Geographic workforce distribution analysis
🛠️ Technologies Used
Power BI: Advanced visualizations and interactive dashboards
DAX: Custom calculations and KPI development
Data Modeling: Relationship optimization and performance tuning
💡 Key Insights
Identified high-risk employee segments for attrition
Analyzed correlation between education levels and job satisfaction
Evaluated department-wise performance patterns
Provided data-driven recommendations for HR policy improvements
Great work on this Power BI HR dashboard! The employee rating analysis and demographic breakdown sections are really well done. I’m also working on similar HR analytics projects, and this gives me so many ideas. What was the most challenging part you faced when building it?
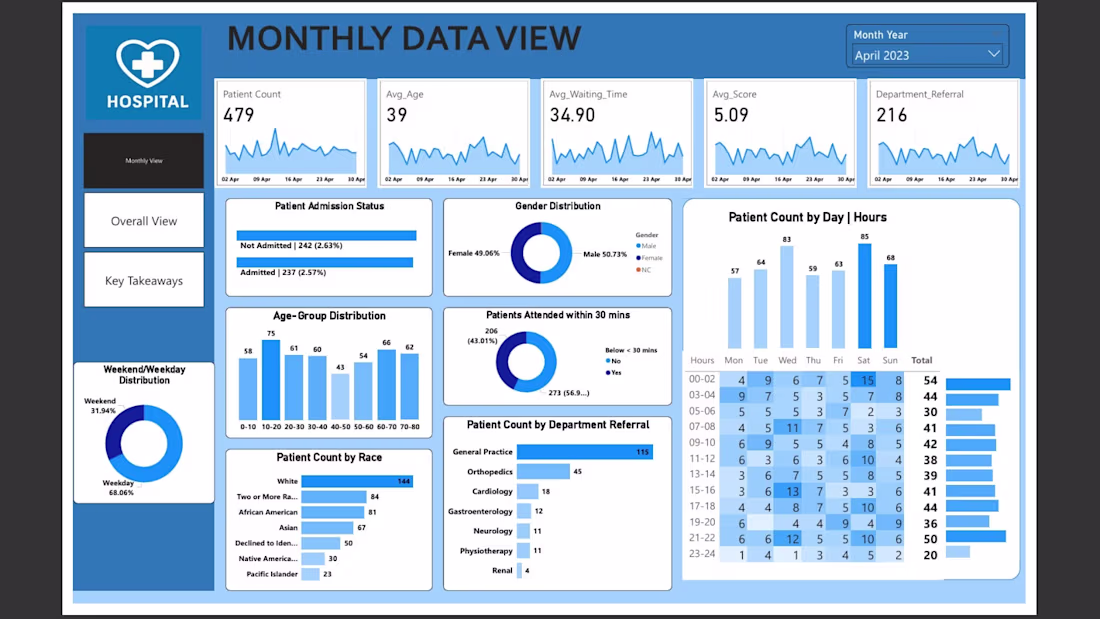
🏥 Hospital Analytics Dashboard
Overview
A comprehensive healthcare analytics solution featuring three interactive Power BI dashboards that analyze patient flow, operational efficiency, and hospital resource management. This project transforms raw hospital data into actionable insights for healthcare administrators and decision-makers.
📊 Dashboard Components
1. Monthly View
Real-time patient metrics with trend analysis
Key performance indicators: Patient count, average age, waiting times, and satisfaction scores
Time-series visualizations for operational planning
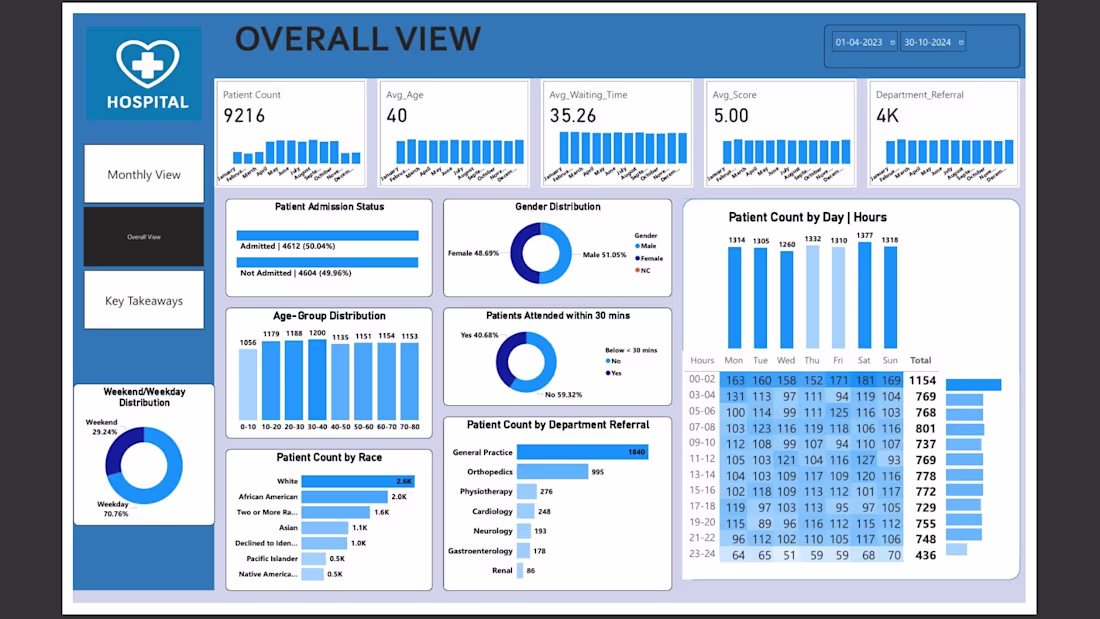
2. Overall View
Comprehensive patient demographics and admission patterns
Department-wise analysis and resource allocation insights
Weekend vs. weekday operational trends
🎯 Key Metrics Analyzed
9,216 total patients across all departments
60% of patients attended within 30 minutes (efficiency benchmark)
7 departments analyzed including General Practice, Orthopedics, and Cardiology
Peak operational hours: 07-08 AM requiring enhanced staffing
🛠️ Technologies Used
Power BI: Multi-page interactive dashboards with advanced visualizations
DAX: Custom measures and calculated columns for KPI development
Data Modeling: Optimized relationships and performance tuning
💡 Business Impact
Identified peak patient flow patterns for staff optimization
Analyzed demographic trends for targeted healthcare services
Provided actionable insights for reducing patient waiting times
Enhanced operational efficiency through data-driven decision making
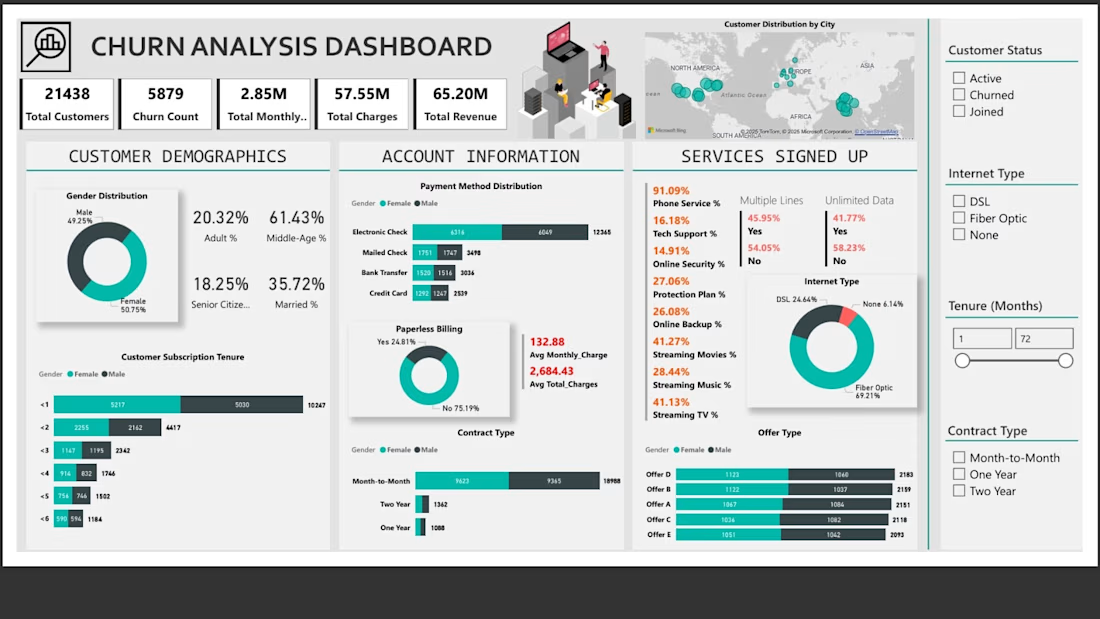
📊 Telecom Churn Analysis Dashboard
🎯 Key Features
Customer Demographics Analysis: Gender distribution, age segments, and tenure patterns
Service Usage Insights: Internet types, contract preferences, and service adoption rates
Financial Metrics: Revenue analysis, monthly charges, and payment method preferences
Churn Prediction Indicators: Key risk factors and customer segmentation
📈 Dashboard Highlights
21,438 total customers analyzed
5,879 churned customers identified
$2.85M total monthly revenue tracked
Interactive visualizations with drill-down capabilities
Geographic distribution mapping
Service-wise performance metrics
🛠️ Technologies Used
Power BI: Interactive dashboard creation and data visualization
💡 Key Insights
Identified high-risk customer segments
Analyzed correlation between contract types and churn rates
Evaluated impact of service offerings on customer retention
Provided data-driven recommendations for reducing churn
Challenges
View allFuser Co-create
$5K15h 44m left332 participants
Morphic Workflows
$10K3d left257 participants
Zo Computer Challenge
$10K3d left549 participants
Anything Ship & Sell Remixathon
$10KStarting in 45m146 participants
Impossible UI with Rive
$10K10d left102 participants
Runway $100k Big Pitch Challenge
$100K10d left178 participants
Trending
Runway
AI video generation is exploding. What are you dreaming up in Runway?
Contra University
Learn from expert creatives how to earn more using next-gen AI tools.
creativeaiflow
Creative AI workflows are evolving. What tools do you use, and what are their strengths and weaknesses?
portfolioreview
The best portfolios tell a story, not just show a grid. Share yours for feedback.
freelancerlife
Freelancer life is wins, pivots, and everything in between. What’s yours right now?