The network for creativity
Join 1.25M professional creatives like you
Connect with clients, get discovered, and run your business 100% commission-free
Creatives on Contra have earned over $150M and we are just getting started
Back to feedPost
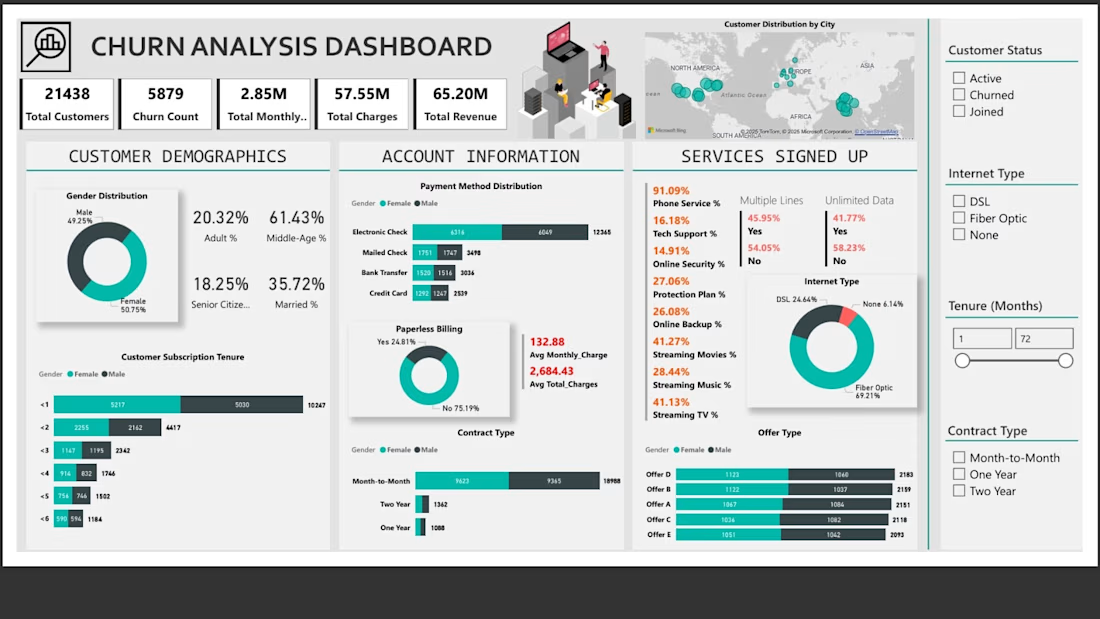
📊 Telecom Churn Analysis Dashboard
🎯 Key Features
Customer Demographics Analysis: Gender distribution, age segments, and tenure patterns
Service Usage Insights: Internet types, contract preferences, and service adoption rates
Financial Metrics: Revenue analysis, monthly charges, and payment method preferences
Churn Prediction Indicators: Key risk factors and customer segmentation
📈 Dashboard Highlights
21,438 total customers analyzed
5,879 churned customers identified
$2.85M total monthly revenue tracked
Interactive visualizations with drill-down capabilities
Geographic distribution mapping
Service-wise performance metrics
🛠️ Technologies Used
Power BI: Interactive dashboard creation and data visualization
💡 Key Insights
Identified high-risk customer segments
Analyzed correlation between contract types and churn rates
Evaluated impact of service offerings on customer retention
Provided data-driven recommendations for reducing churn
The network for creativity
Join 1.25M professional creatives like you
Connect with clients, get discovered, and run your business 100% commission-free
Creatives on Contra have earned over $150M and we are just getting started
Related posts
📊 Transform Your Data into Real Business Value.
At Intersect Analytics, we help businesses move beyond spreadsheets and static reports to powerful, decision-driven insights.
We specialize in:
✔ Interactive dashboards (Power BI, Excel)
✔ Data analysis & visualization
✔ Financial and operational analytics
✔ Automation using SQL & Python
✔ Predictive and performance insights
💡 Our focus is simple—turn complex data into clear, actionable intelligence that drives growth and efficiency.
🚀 Intersect Analytics – Where Data Meets Decisions.
great job👌
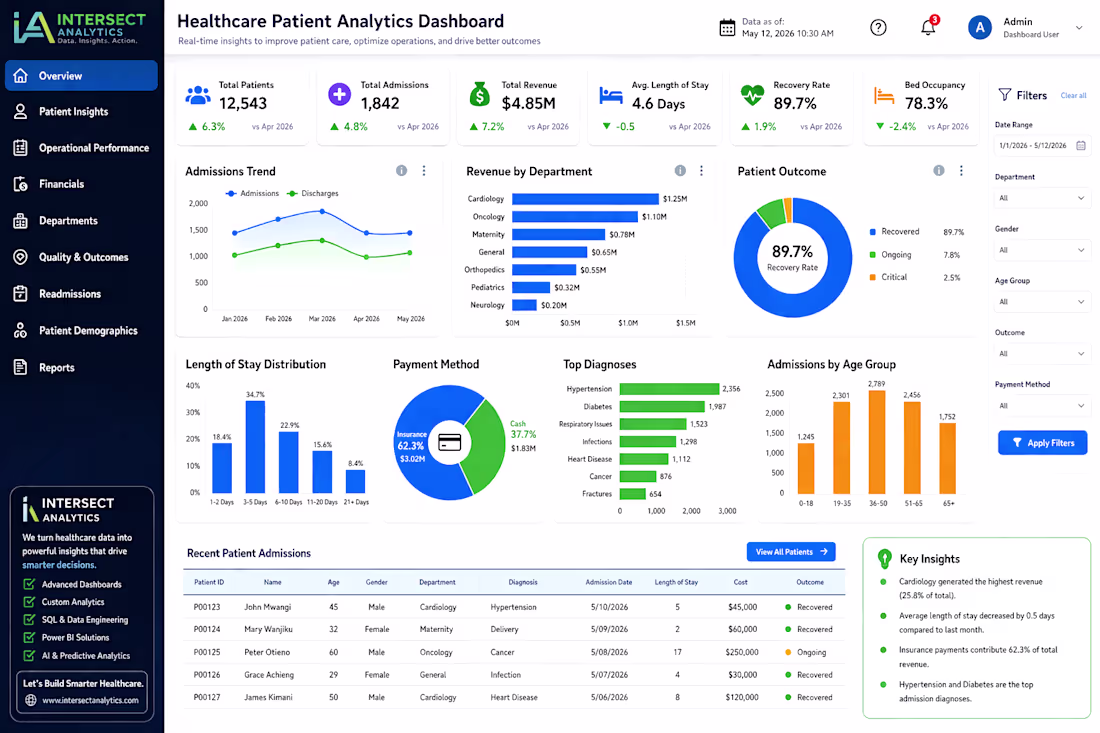
Transforming Healthcare Data into Actionable Intelligence
Healthcare organizations generate significant volumes of data, yet the true value lies in the ability to convert that data into clear, reliable, and decision-ready insights.
At Intersect Analytics, we provide tailored analytics solutions designed to support both clinical and operational excellence. Our services include:
✔ Development of interactive dashboards for real-time performance monitoring
✔ Advanced data analysis to identify trends, risks, and opportunities
✔ Predictive analytics to support early intervention and proactive care
✔ Automation of reporting processes to improve efficiency and accuracy
✔ Data structuring and integration to ensure consistency and reliability
Our approach focuses on delivering insight-driven solutions that enable healthcare providers to enhance patient outcomes, optimize resource utilization, and support strategic decision-making.
If your organization is looking to leverage data more effectively, we would welcome the opportunity to support your analytics journey.
🚀 Intersect Analytics – Enabling smarter decisions through data.
Trending
Runway
AI video generation is exploding. What are you dreaming up in Runway?
Contra University
Learn from expert creatives how to earn more using next-gen AI tools.
creativeaiflow
Creative AI workflows are evolving. What tools do you use, and what are their strengths and weaknesses?
portfolioreview
The best portfolios tell a story, not just show a grid. Share yours for feedback.
freelancerlife
Freelancer life is wins, pivots, and everything in between. What’s yours right now?