The network for creativity
Join 1.25M professional creatives like you
Connect with clients, get discovered, and run your business 100% commission-free
Creatives on Contra have earned over $150M and we are just getting started
Back to feedPost
Cash Flow Diagnostic — Services Business.
A growing services company (~$1.2M revenue, 15–20 employees) was profitable but under constant cash pressure. As the business scaled, decisions became reactive due to limited visibility into cash behavior.
Problem:
Liquidity felt tight, but the P&L didn’t explain why. The issue wasn’t performance — it was understanding cash drivers.
Approach:
I ran a structured diagnostic using existing data only, focused on clarity:
• Cash inflows vs outflows
• Fixed vs variable costs
• Key liquidity ratios
• Cash and expense trends
No assumptions were changed.
Key Insights:
• Revenue growth masked cash gaps caused by payment timing
• Fixed costs reduced flexibility
• Profitability alone didn’t explain liquidity stress
Outcome:
The founder gained clear visibility into cash drivers and risk exposure.

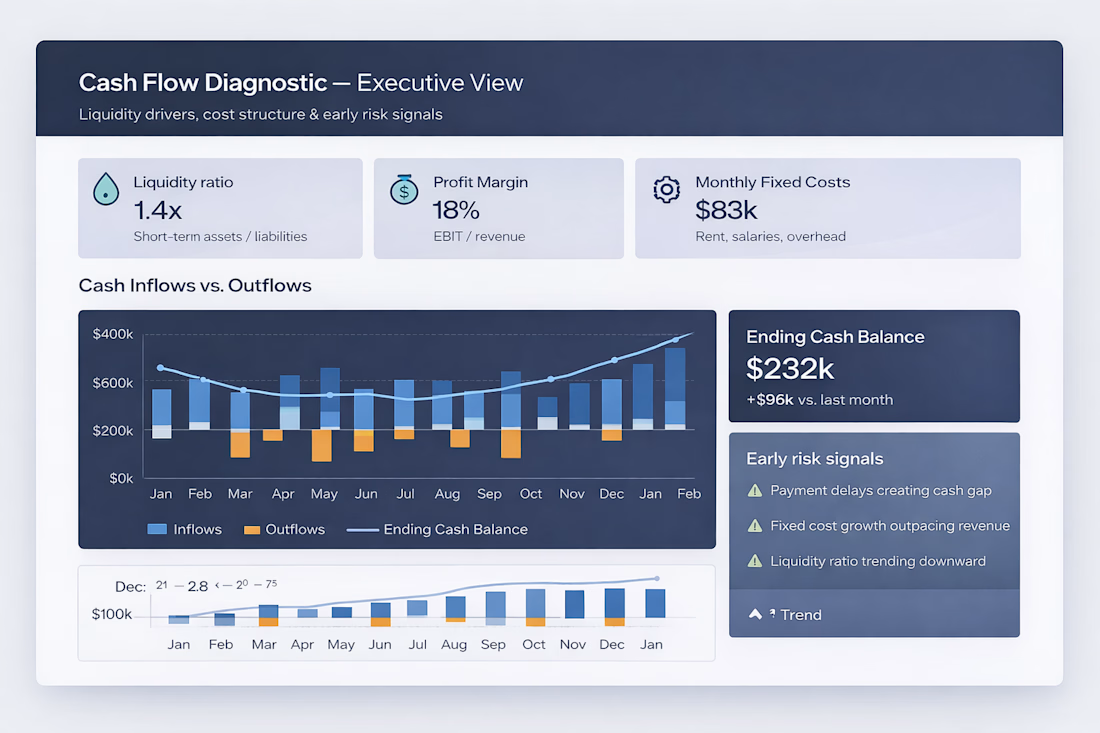

Strong example of why P&L alone is a poor proxy for cash health. Payment timing and fixed cost rigidity usually surface only when inflow/outflow views are made explicit. Dashboards like this prevent reactive decisions.

Thank you — exactly. Cash issues rarely come from a single problem. Payment timing and fixed cost rigidity usually surface first, especially when growth accelerates. Making inflows and outflows explicit is often what allows founders to move from reactive decisions to deliberate ones.
Exactly — growth amplifies timing issues that were already there. I’ve also seen founders regain control just by separating operational cash from growth-driven cash needs. Once that line is clear, decisions get much calmer.
Exactly. When cash dynamics are made explicit early, decisions become deliberate rather than defensive. That’s usually the difference between controlled growth and reactive growth.
The network for creativity
Join 1.25M professional creatives like you
Connect with clients, get discovered, and run your business 100% commission-free
Creatives on Contra have earned over $150M and we are just getting started





Related posts

The client's inventory wasn't organized. Products weren't consistently recorded, there was no SKU structure, and the system's stock figures didn't match what was physically on the shelves. That made it hard to know what they really had, what it was worth, and what their cost of sales should be.
What I did
Chose the right tool. I recommended QuickBooks Plus, which handles inventory tracking properly, rather than patching up spreadsheets.
Built the product list. I added every product to the system and allocated a clear SKU to each one.
Sorted the inventory. I organized the stock records so each item could be identified and tracked.
Reconciled to a physical count. I compared the system quantities with the actual stock on hand and resolved the differences.


Ambitious B.Com student seeking a remote opportunity to apply my communication, analytical, business, and organizational skills in a professional environment. I am a quick learner, disciplined, adaptable, and comfortable working independently. I am eager to take responsibility, learn industry-relevant skills, contribute to business goals, and build strong practical experience alongside my studies.

A bookkeeper who only reconciles is doing half the job. 📊
Debits equal credits. The bank statement matches. The books are "balanced." But do the numbers actually make sense?
Good bookkeeping isn't about matching figures. It's about understanding the business:
✅ How it really earns and spends, from scratch
✅ What the P&L, balance sheet and cash flow are telling you
✅ Where the business can go, based on the numbers it has today
When your numbers make sense, you can spot trends early, fix the leaks, and plan growth with confidence. That's the difference between a bookkeeper who records the past and one who helps shape the future.
Don't just balance the books. Understand the business. 💡
💬 What's the one number in your business you still don't fully understand? Tell me below.
Follow me for more bookkeeping and accounting insights.
#Bookkeeping #Accounting #SmallBusiness #UAEBusiness #USABusiness #Entrepreneurs #FinancialLiteracy #BusinessGrowth #CashFlow #Startups #Accountant #CountingCrux