The network for creativity
Join 1.25M professional creatives like you
Connect with clients, get discovered, and run your business 100% commission-free
Creatives on Contra have earned over $150M and we are just getting started
Back to feedPost
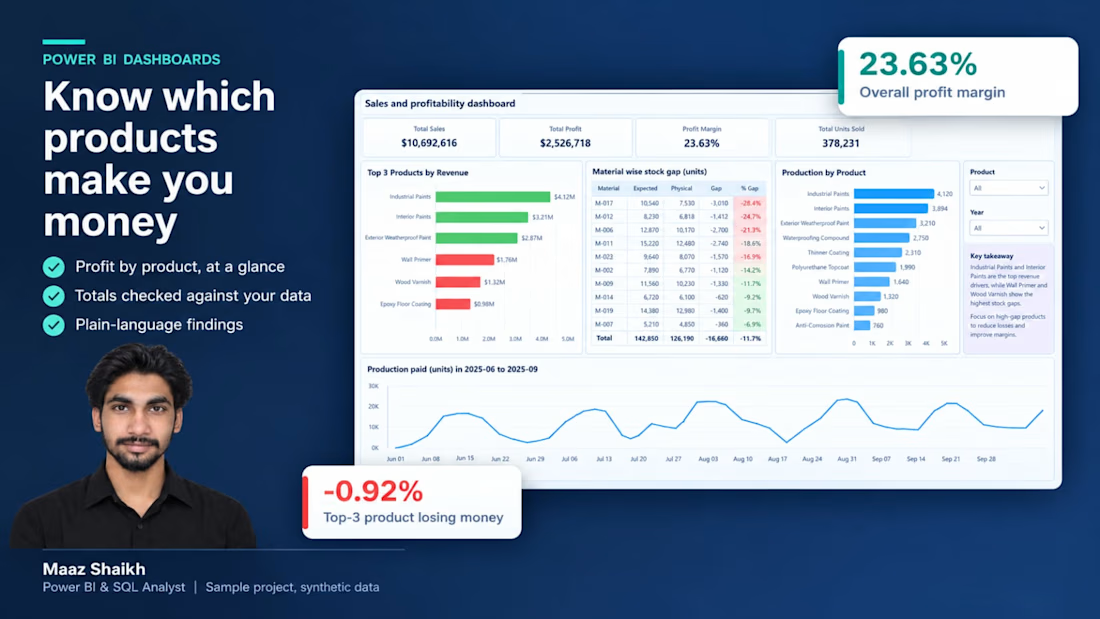
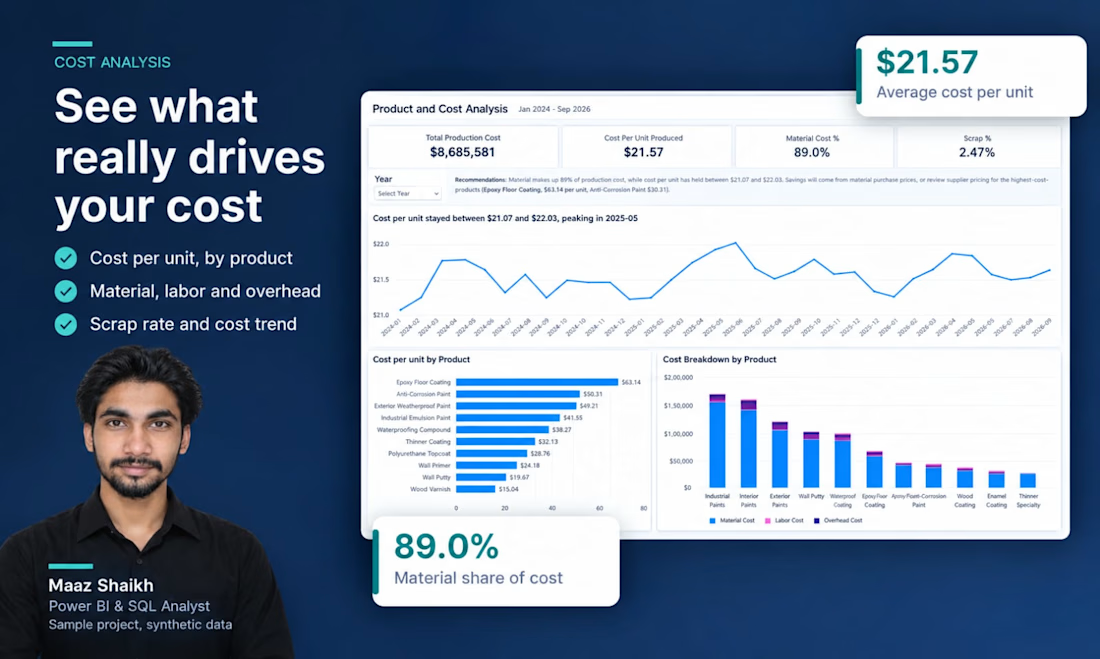
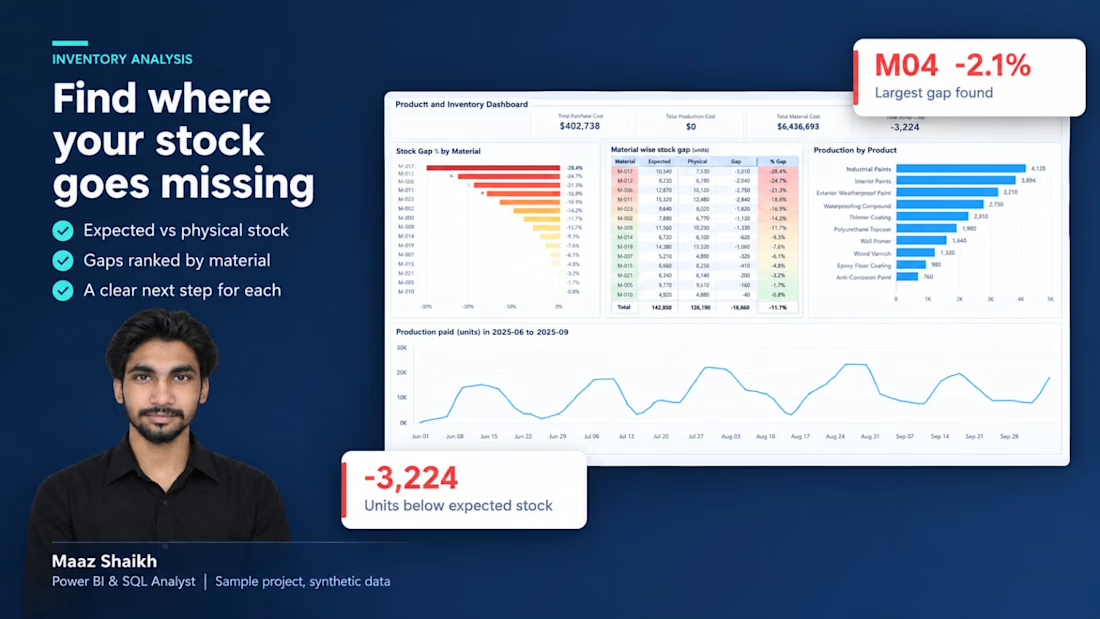
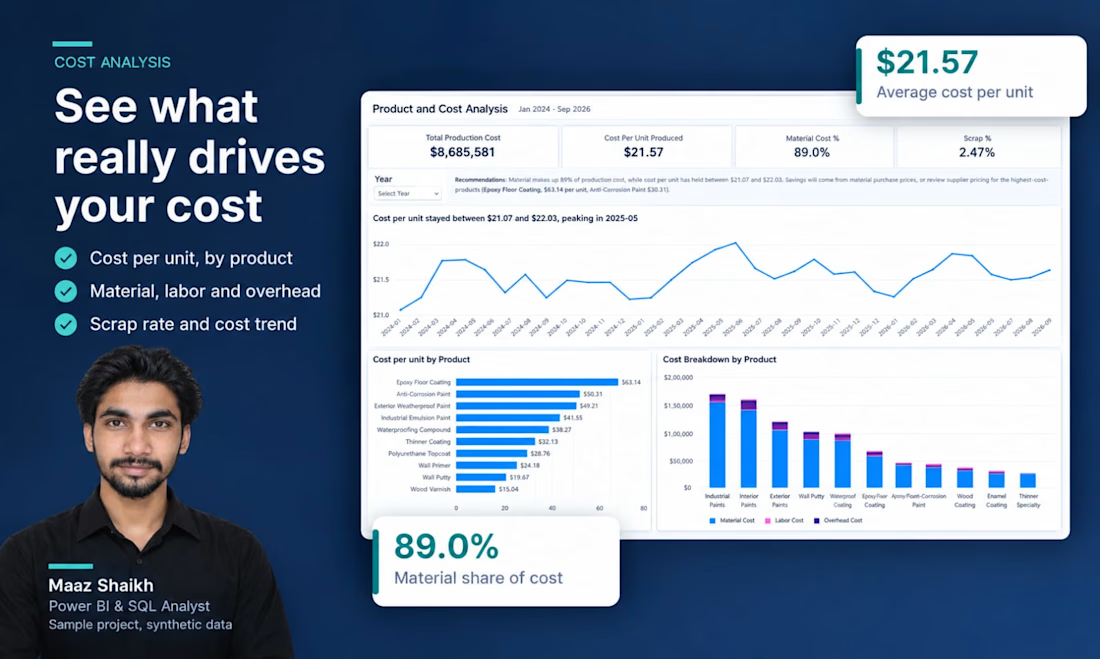
Built an end-to-end Manufacturing Analytics project using SQL and Power BI.
The project focuses on analyzing sales performance, inventory levels, product costs, and estimated profitability.
Key business insights:
• Sales performance and monthly trends
• Inventory tracking and stock analysis
• Product-level cost and margin analysis
• Bulk vs Regular order comparison
Tools: SQL Server, Power BI, DAX.
This is an independent portfolio project demonstrating practical business analytics skills.
The network for creativity
Join 1.25M professional creatives like you
Connect with clients, get discovered, and run your business 100% commission-free
Creatives on Contra have earned over $150M and we are just getting started
Related posts

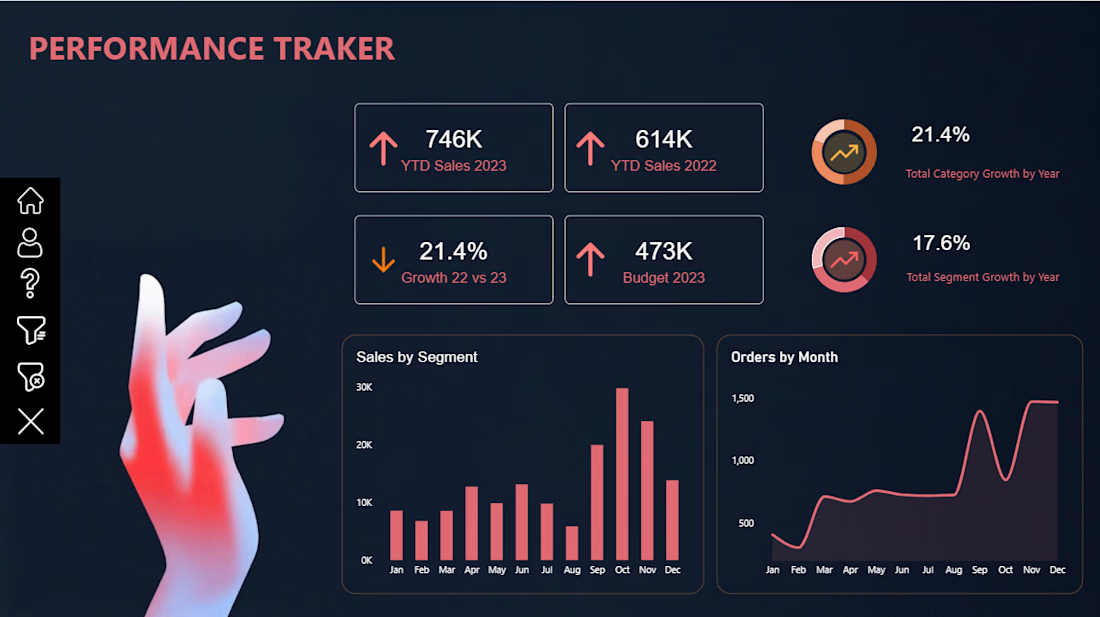
📊 Power BI Performance Tracker Dashboard
Turning raw data into meaningful insights!
I’m excited to share my latest Power BI Dashboard-Performance Tracker, designed to provide a clear and interactive view of business performance.
Key Features:
📈 YTD Sales Performance (2022 vs. 2023)
🎯 Budget vs. Actual Sales Analysis
📊 Sales Growth & Performance KPIs
🗂️ Sales Analysis by Segment
📅 Monthly Order Trends
📉 Category & Segment Growth Analysis
Tools Used: Microsoft Power BI | Data Visualization | Dashboard Design
My goal was to create a clean, modern, and visually engaging dashboard that makes complex business data easier to understand and supports better decision-making.
Always learning, building, and transforming data into insights!
#PowerBI #DataAnalytics #DataVisualization #BusinessIntelligence #DashboardDesign #MicrosoftPowerBI #DataAnalyst #Contra



Road Safety Analysis | Python, SQL & Power BI
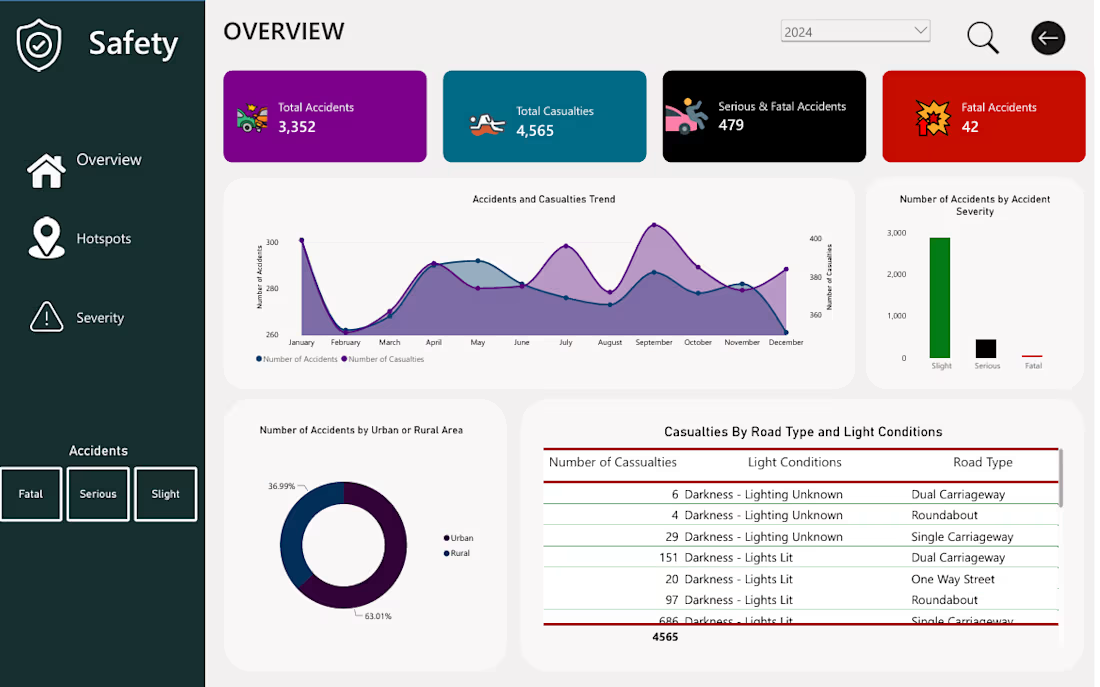
Developed an end-to-end road safety analytics project to help authorities understand accident patterns, identify high-risk areas, and make informed decisions about road safety interventions.
The project involved cleaning and preparing road accident data using Python and Pandas, followed by SQL-based exploratory analysis to investigate accident trends, casualty figures, severity distributions, and geographical patterns.
Using Power BI, I transformed the findings into an interactive dashboard featuring key performance indicators and visualisations that provide an overview of accident activity, highlight trends over time, and reveal differences in accident occurrence across districts and locations.
The analysis also explored accident severity in relation to road types, weather conditions, lighting, and road surface conditions.
Tools used: Python, Pandas, SQL, Power BI.
Project deliverable: An interactive Power BI dashboard supported by data cleaning, transformation, and SQL analysis.
The objective was to turn raw accident data into clear, meaningful insights that can support evidence-based road safety planning and resource prioritisation.



Built an end-to-end Manufacturing Analytics project using SQL and Power BI.
The project focuses on analyzing sales performance, inventory levels, product costs, and estimated profitability.
Key business insights:
• Sales performance and monthly trends
• Inventory tracking and stock analysis
• Product-level cost and margin analysis
• Bulk vs Regular order comparison
Tools: SQL Server, Power BI, DAX.
This is an independent portfolio project demonstrating practical business analytics skills.