The network for creativity
Join 1.25M professional creatives like you
Connect with clients, get discovered, and run your business 100% commission-free
Creatives on Contra have earned over $150M and we are just getting started
Back to feedPost

Designed an end-to-end, multi-page Power BI Analytics Dashboard analyzing global laptop market dynamics, hardware specifications, brand market shares, and pricing matrices for over 1.2K+ laptop configurations.
Key Highlights & Technical Features:
1. Market Dynamics Overview: Tracked core industry KPIs including 19 Total Brands, 60K Average Price, 413M Max Price, and company market share distributions (Dell, Lenovo, HP, Asus, etc.).
2. Hardware Specification Insights: Built a detailed Processor & Graphics Price Matrix alongside RAM capacity trends (Average Price Trend by RAM Capacity) and a Laptop Weight vs. Pricing correlation scatter plot.
3. Specification Search Engine: Implemented a dedicated Master Table Inventory Log page featuring dynamic multi-criteria slicers (Price range, Company, RAM, and Operating System) allowing users to query specific hardware specs instantly.
4. Advanced Visualizations & Interactive Navigation: Incorporated donut charts for TypeName shares, line charts for OS price trends, gauge charts, and seamless page navigation buttons for granular market exploratory analysis.


The network for creativity
Join 1.25M professional creatives like you
Connect with clients, get discovered, and run your business 100% commission-free
Creatives on Contra have earned over $150M and we are just getting started
Related posts

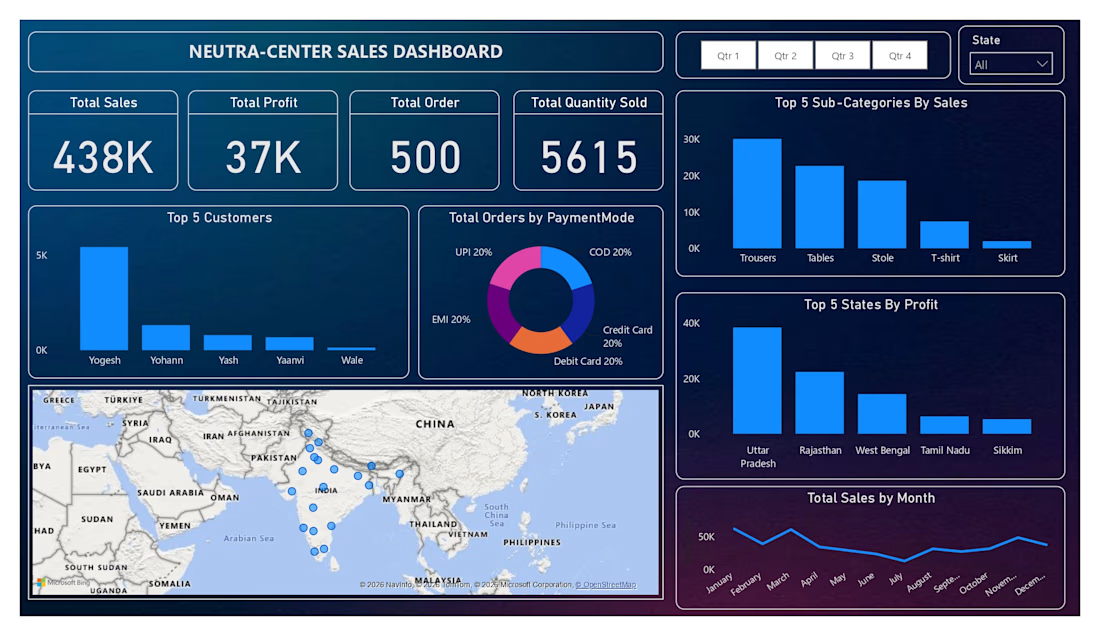
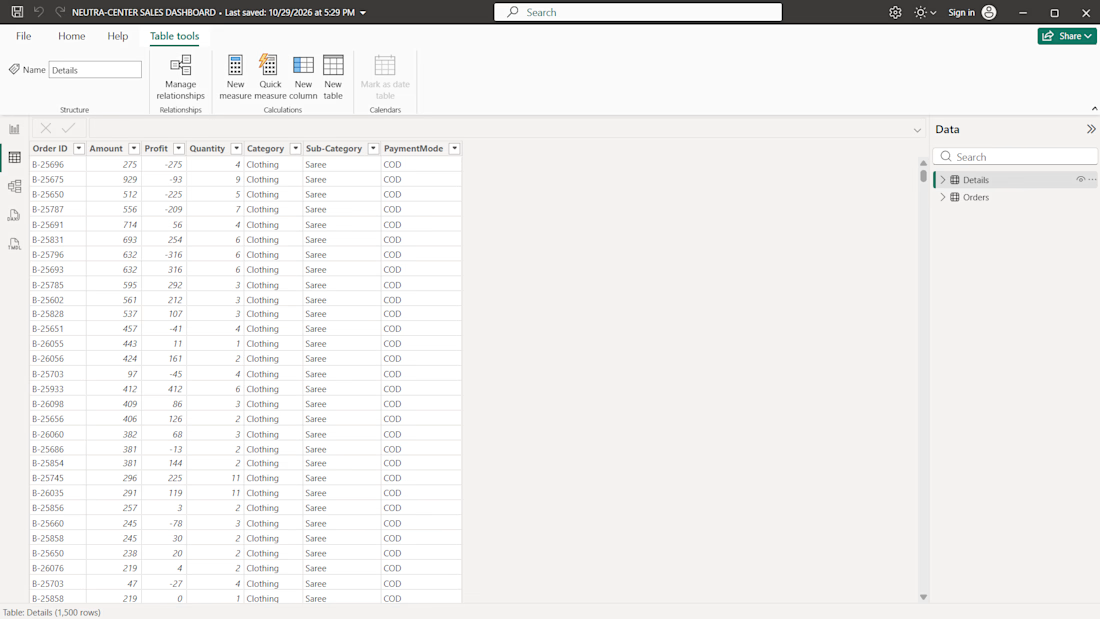
I created an interactive "Neutra-Center Sales Dashboard using Microsoft Power BI" to transform sales excel data into clear, meaningful business insights.
Key Features:
- Interactive quarterly and state filters
- Sales and profit KPI cards
- Customer and product performance analysis
- Payments method distribution
- State-wise profit coparison
- Monthly sales trend visualization
- Geographic sales distribution map
- Clean, modern dashboard design
This project demonstrates my ability to present sales data in an organized, interactive, and visually appealing format to help user understand business performance and identify important trends.
📊 Power BI Performance Tracker Dashboard
Turning raw data into meaningful insights!
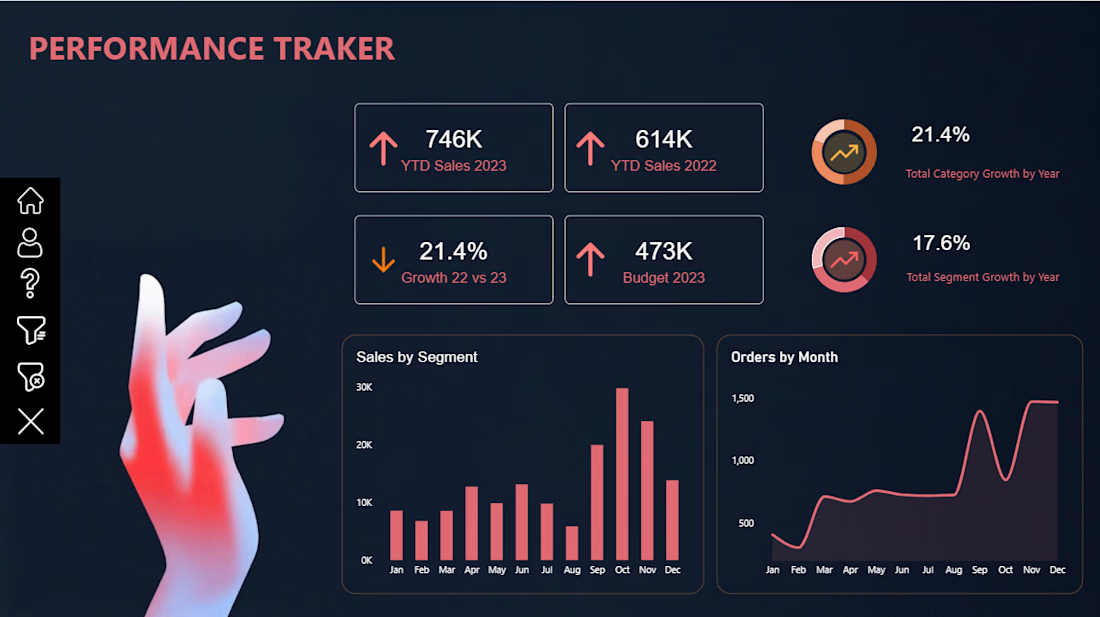
I’m excited to share my latest Power BI Dashboard-Performance Tracker, designed to provide a clear and interactive view of business performance.
Key Features:
📈 YTD Sales Performance (2022 vs. 2023)
🎯 Budget vs. Actual Sales Analysis
📊 Sales Growth & Performance KPIs
🗂️ Sales Analysis by Segment
📅 Monthly Order Trends
📉 Category & Segment Growth Analysis
Tools Used: Microsoft Power BI | Data Visualization | Dashboard Design
My goal was to create a clean, modern, and visually engaging dashboard that makes complex business data easier to understand and supports better decision-making.
Always learning, building, and transforming data into insights!
#PowerBI #DataAnalytics #DataVisualization #BusinessIntelligence #DashboardDesign #MicrosoftPowerBI #DataAnalyst #Contra

Designing high-density SaaS - Salon dashboards that don't feel overwhelming!


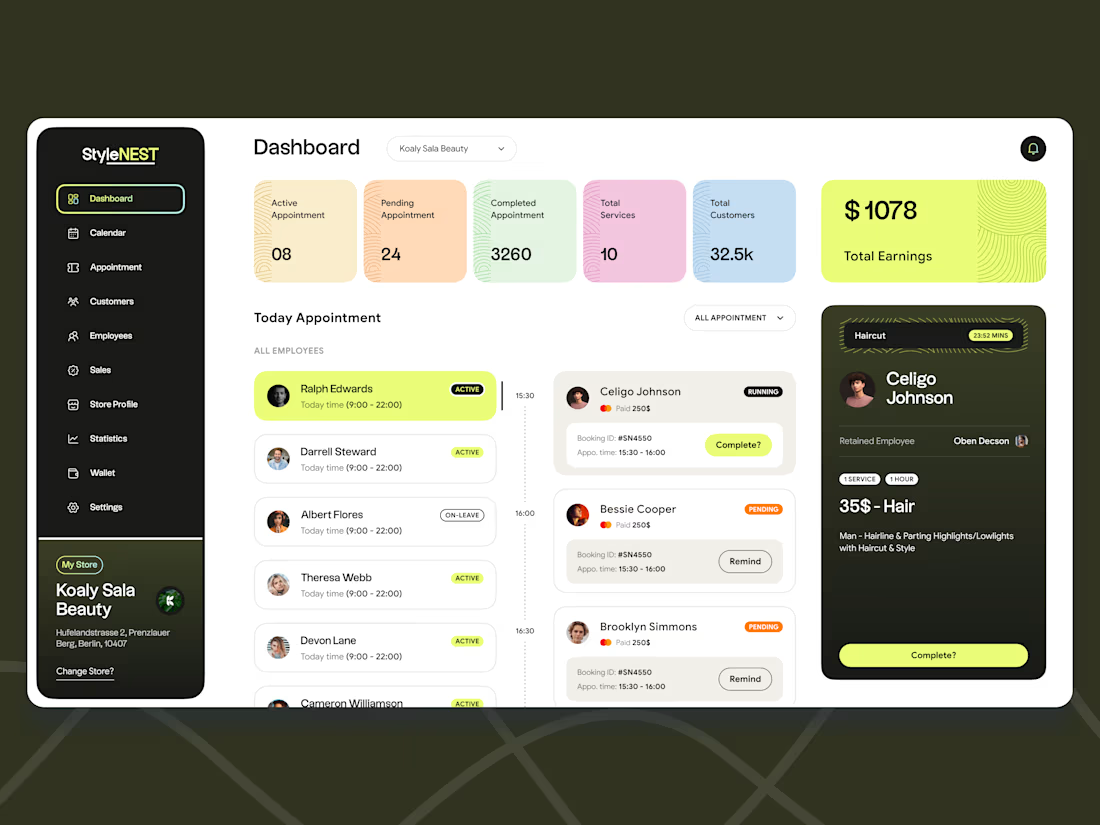

Easy to scan.