The network for creativity
Join 1.25M professional creatives like you
Connect with clients, get discovered, and run your business 100% commission-free
Creatives on Contra have earned over $150M and we are just getting started
Back to feedPost

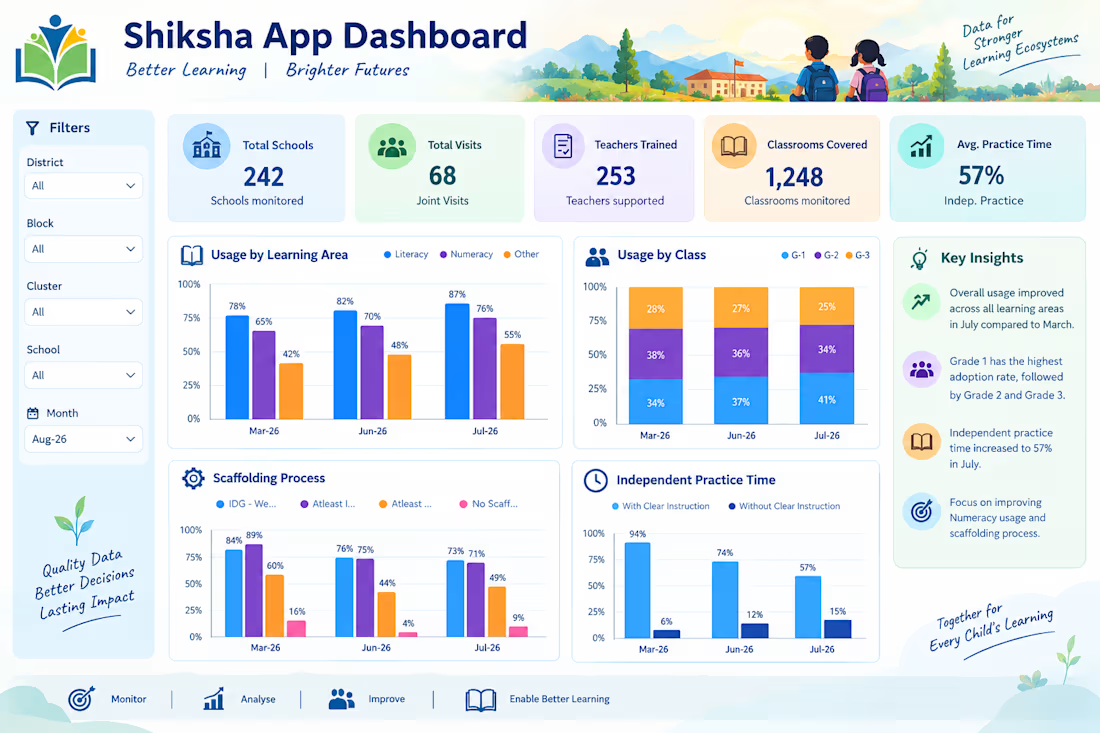
Turning monitoring data into actionable insights—designing dashboards that help teams track, understand, and improve program outcomes. #M&E #DataAnalytics #PowerBI #MIS #DataVisualization

The network for creativity
Join 1.25M professional creatives like you
Connect with clients, get discovered, and run your business 100% commission-free
Creatives on Contra have earned over $150M and we are just getting started
Related posts

Business data often lives across payment, analytics, CRM, advertising, and inventory platforms. Metrik brings those signals together in one dashboard built for startups and small businesses.
See revenue, orders, customers, and business health at a glance. Compare advertising spend and ROAS across channels, explore visual KPI cards, and use smart alerts to spot unusual changes and potential risks.
The interface pairs a clean layout and rounded components with soft gradients, colorful analytics, and clear visual hierarchy, helping make business performance easier to follow.



Courtsy makes it easier to find and book sports courts from your phone. Explore nearby venues on a map, choose a sport, check court details and availability, then reserve a time slot.
The personal dashboard keeps upcoming bookings, spending, and savings in one place. A bold purple and yellow visual identity, expressive typography, and playful sports elements bring energy to the experience.