The network for creativity
Join 1.25M professional creatives like you
Connect with clients, get discovered, and run your business 100% commission-free
Creatives on Contra have earned over $150M and we are just getting started
Back to feedPost

Customer Shopping Insights Dashboard
A fast, user-friendly Streamlit web app designed to turn raw retail data into actionable business insights without any clutter or complexity.
What This Dashboard Does:
Smart File Check: Simply upload your sales CSV file. The app
automatically checks if the file structure, columns, and data types are
correct before processing—ensuring error-free reports.
Instant Executive KPIs: Get a clear overview of Total Revenue, Average
Order Value, Total Customer Count, and Average Review Ratings at
a glance.
Interactive Filtering: Easily filter your data by age, product categories,
shipping methods, or locations using simple sliders and dropdowns.
Table Reports & Visuals: Switch between organized summary tables and
clear interactive charts to see top-performing products, customer age
demographics, location trends, and payment preferences.
Tested & Ready: Pre-tested with Kaggle’s Customer Shopping Preferences
dataset (3,900+ customer records) to ensure seamless handling of real-
world shopping data.
Why It Feels So Fast:
Powered by Polars (an ultra-fast data processing engine built in Rust) instead of standard Python tools, this dashboard handles filtering, sorting, and reporting instantaneously—giving you a smooth, lag-free experience.
Note: Check out the attached screen recording video above to see the interactive upload flow, real-time filtering, and visual reports in action!


The network for creativity
Join 1.25M professional creatives like you
Connect with clients, get discovered, and run your business 100% commission-free
Creatives on Contra have earned over $150M and we are just getting started


Related posts

What if your data looked like a beautifully printed science book?
For my first project here, I built something I dearly wanted for myself, a Genome Atlas: an editorial dashboard that reads the human genome like a book, chapter by chapter.
Three billion letters. Twenty thousand genes. Sixty-four codons that spell only twenty amino acids. I wanted to turn these numbers into something you feel before you read it: soft pastel watercolour, clean ink lines, and charts you can play with.
Ten chapters, ten ways to see data: chromosomes as gel lanes you can sort, a wheel of the genetic code that lights up every synonym, base pairs drawn like a chemistry textbook, and an animated flow that shows what you inherited from each grandparent.
Every figure comes with its source, because beautiful should never mean approximate.
It's now available for use here!


Turning 3 billion base pairs into a soft watercolour science book is seriously next-level craft, Sarah!
Quick nerd note from the startup legal side, since you're selling this as a digital product, adding a clear Single-User vs. Commercial License note (and a no-redistribution...

Energy dashboards don't have to feel like spreadsheets.
This is a concept redesign of an energy-data platform's overview screen. The aim was to keep it dense enough for traders and asset managers, but calm enough to read at a glance.

Nice UI

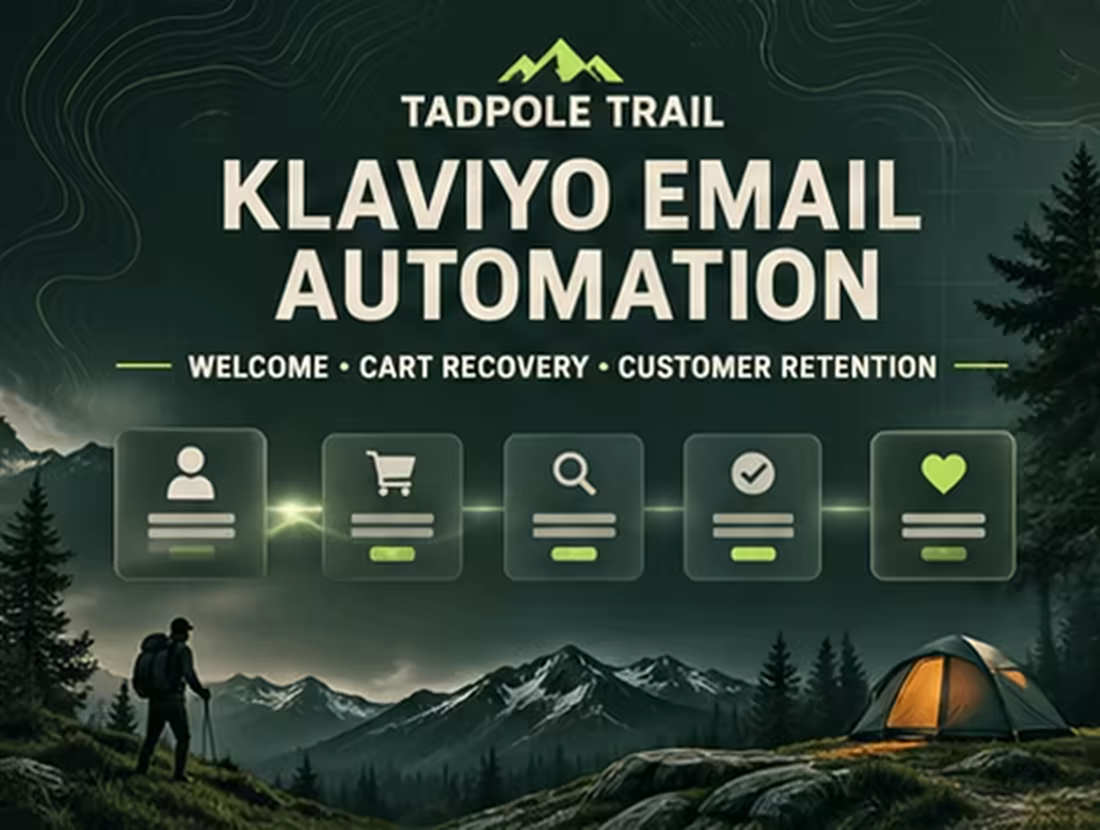
Klaviyo automation for Tadpole Trail, covering welcome series, cart recovery, browse abandonment, post-purchase, customer winback, and popup forms


Nice this