The network for creativity
Join 1.25M professional creatives like you
Connect with clients, get discovered, and run your business 100% commission-free
Creatives on Contra have earned over $150M and we are just getting started
Back to feedPost
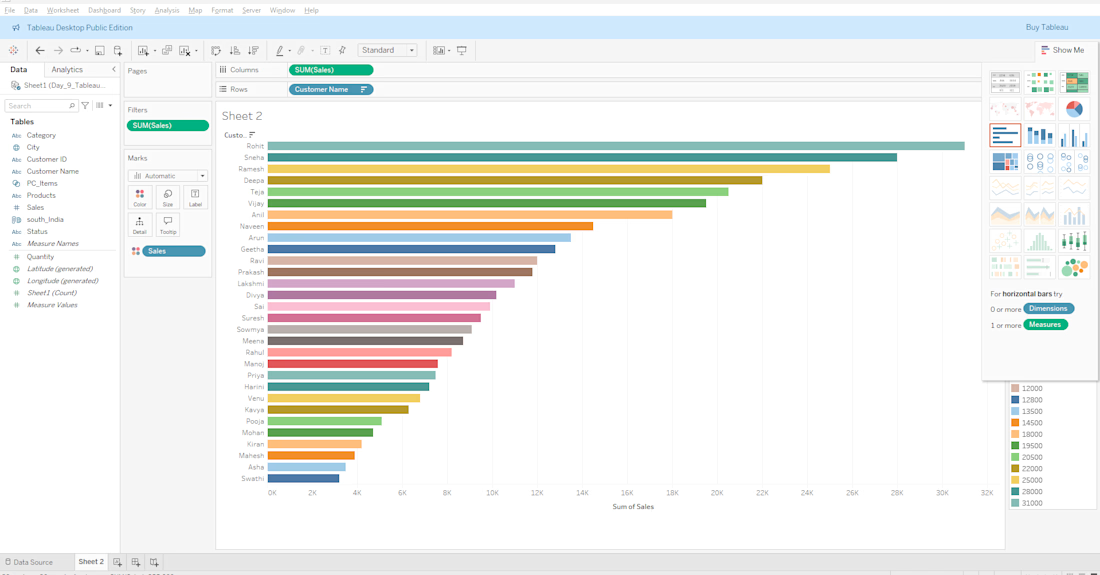
Title: Power BI Sales Analytics Dashboard
Description:
This is a Power BI Sales Analytics Dashboard built to track business performance in real-time.
Key Features:
Revenue Tracking: $1.8M with 8.2% YoY growthProfit Margin Analysis: 22.5% with category-wise breakdownRegional Performance: North & Central regions are top performersMonthly Trend Analysis: Revenue grew from 120K to 190KTools Used: Power BI, DAX, SQL, Excel
Impact: Helped management to identify top-selling categories (Electronics 35%) and focus on high-growth regions.
This dashboard uses interactive filters for Date, Region, and Category to provide actionable insights.Simple ga kavali ante short version:Interactive Power BI dashboard for Sales & Profit analysis. Shows revenue, profit margin, regional sales, and monthly trends. Built with Power BI, DAX, and SQL to help business decisions.


The network for creativity
Join 1.25M professional creatives like you
Connect with clients, get discovered, and run your business 100% commission-free
Creatives on Contra have earned over $150M and we are just getting started







Related posts

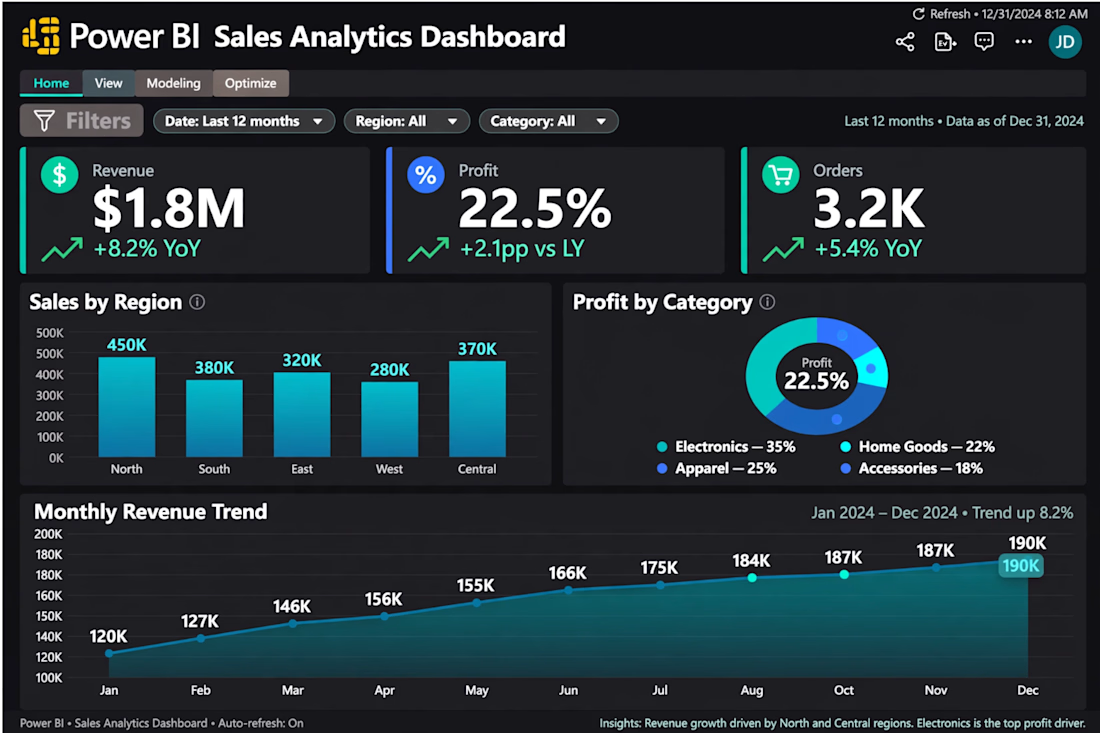
AI-powered financial analytics platform built with FastAPI, Pandas, DuckDB, and Gemini API for data analysis, REST APIs, natural-language-to-SQL queries, and automated business insights.


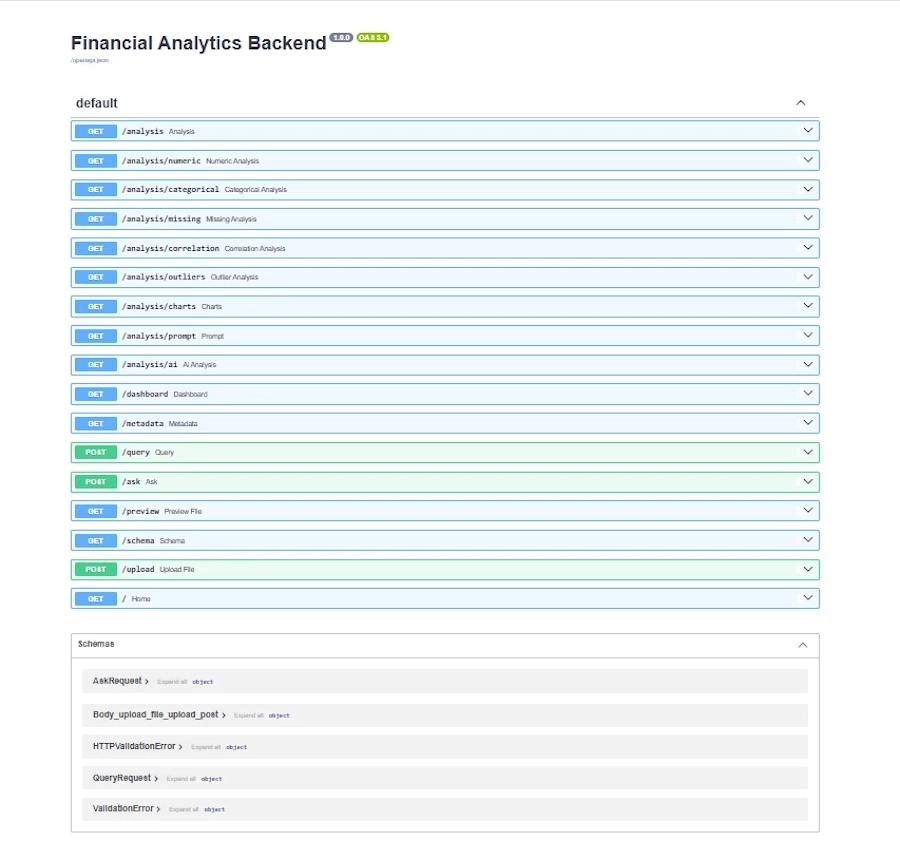

Sales Analysis Dashboard - Built in Tableau. Shows total revenue, profit by category, region-wise performance. Helped client identify top 3 products driving 70% sales. Tool: Tableau Public.
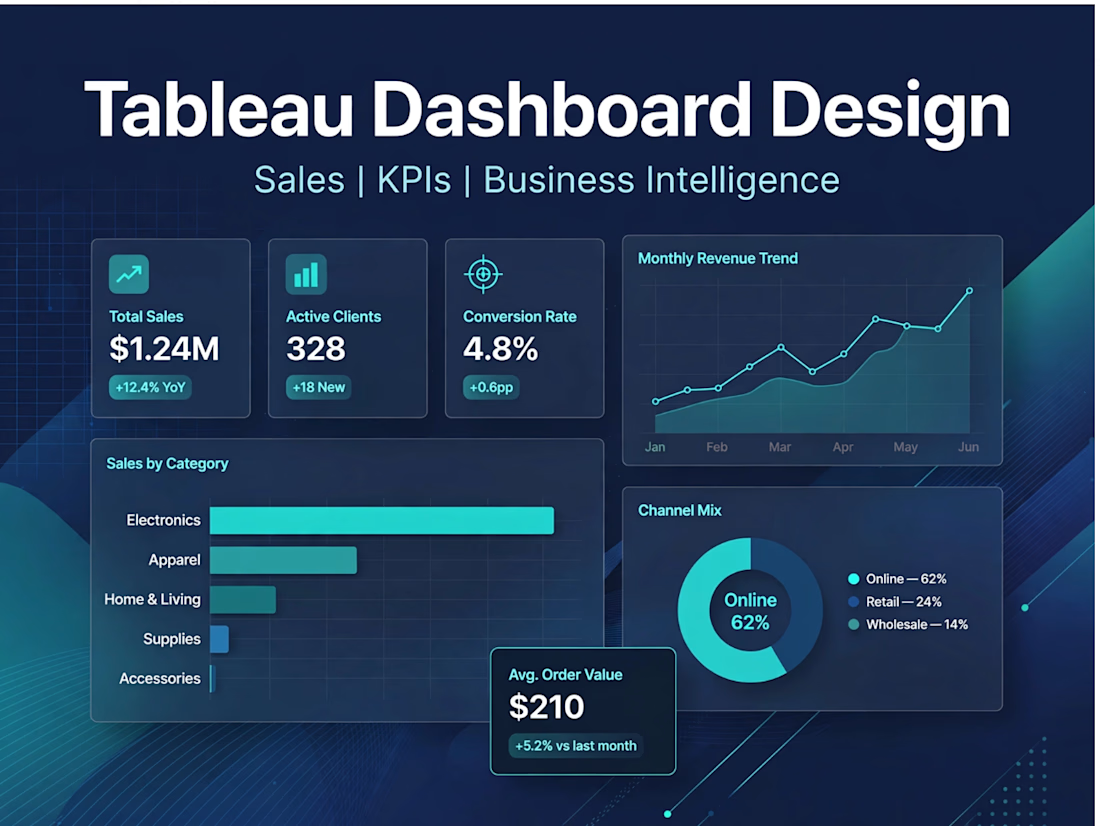
📊 Project: Customer-wise Sales Analysis
What I did:
• Created horizontal bar chart in Tableau to visualize top 30 customers by revenue
• Sorted SUM(Sales) descending to highlight highest revenue drivers
• Identified top performers: Rohit (31K), Sneha (28K), Akhila (26K)
• Applied color differentiation and data labels for clear insights
Tools Used: Tableau Public, Excel, Data Cleaning, Sorting, Aggregation
Outcome: Helps business focus on high-value customers for retention strategy.
Live Dashboard: [Paste your Tableau Public link here if you have]