The network for creativity
Join 1.25M professional creatives like you
Connect with clients, get discovered, and run your business 100% commission-free
Creatives on Contra have earned over $150M and we are just getting started
Back to feedPost
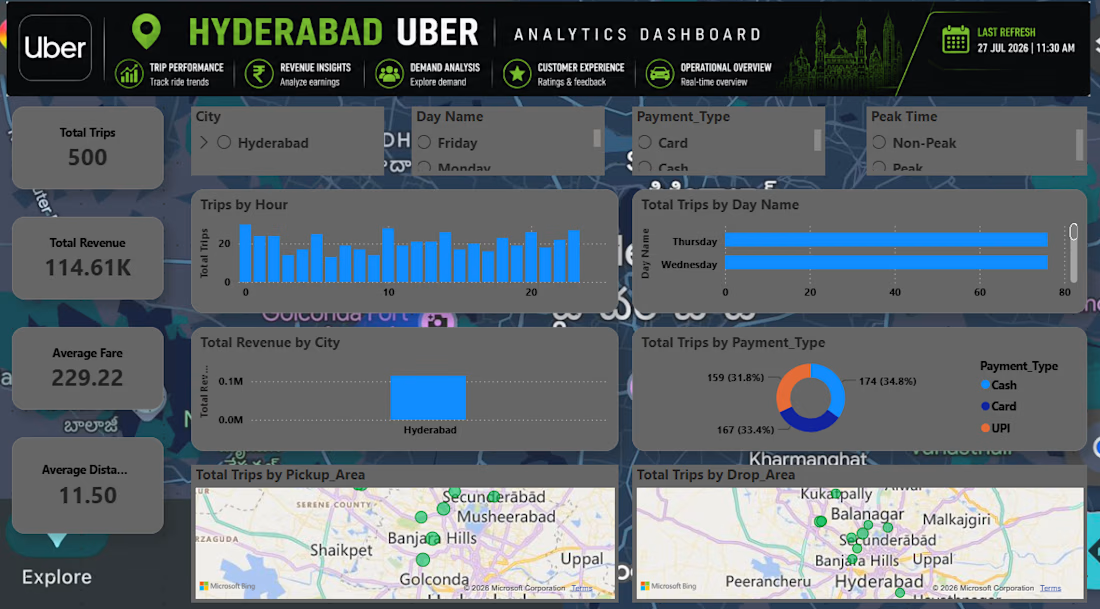
“I developed an Uber Analytics Dashboard using Power BI to analyze trip performance, revenue, demand, customer experience, and operational trends. I worked on data cleaning and transformation using Power Query, created DAX measures and KPIs, and designed interactive visuals for trips by hour/day, revenue, payment types, pickup and drop areas, average fare, and distance. The dashboard helps identify peak demand periods, revenue patterns, popular areas, and customer payment preferences for better business decision-making.”


The network for creativity
Join 1.25M professional creatives like you
Connect with clients, get discovered, and run your business 100% commission-free
Creatives on Contra have earned over $150M and we are just getting started





Related posts

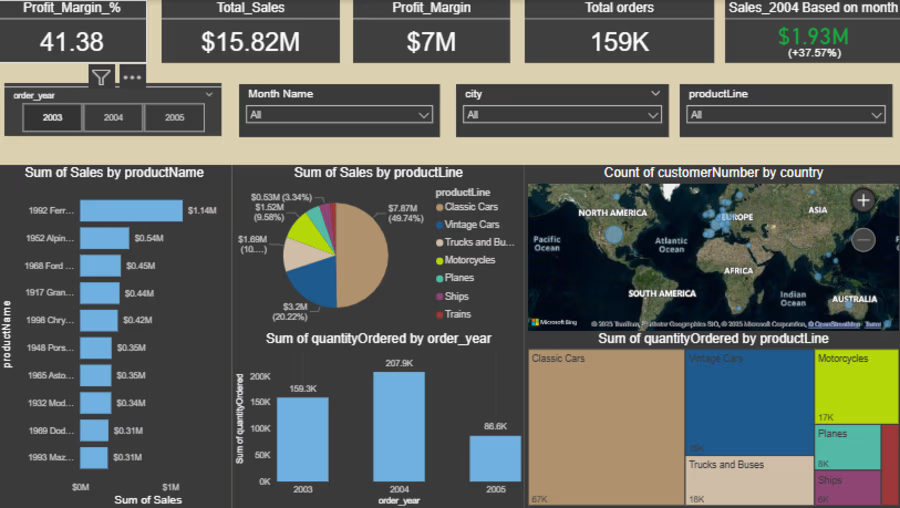
I Created Microsoft Power BI Dashboard By using many of the Tools
🚀 Data Modelling
🧠 Data Visualization
🚀 Group By
🧠 Data Cleaning

My Data Analytics Work
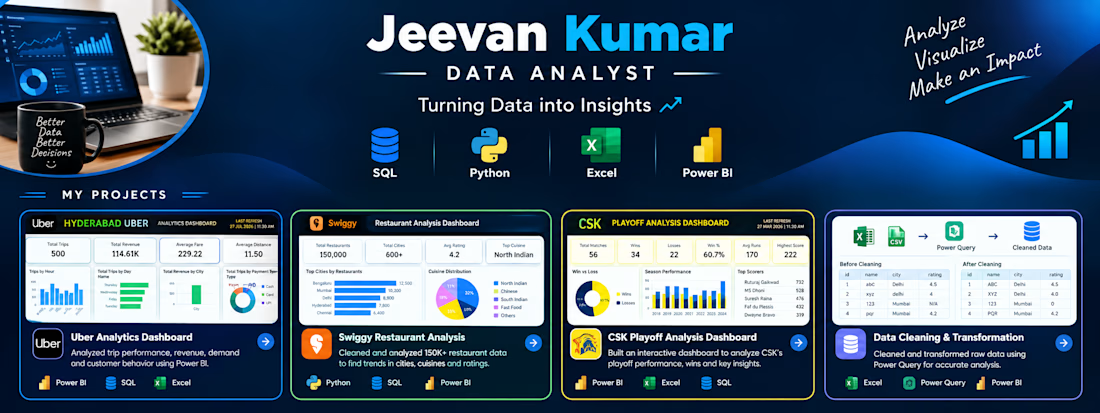
I have worked on four data analytics projects using SQL, Python, Excel, Power Query, and Power BI. My work includes cleaning and transforming raw datasets, creating interactive dashboards, developing DAX measures and KPIs, and analyzing business trends. I built dashboards for Uber trip and revenue analytics, Swiggy restaurant analysis, and CSK playoff performance, while also applying data-cleaning techniques to prepare accurate datasets. These projects helped me develop practical skills in data analysis, visualization, reporting, and extracting meaningful insights from data.

This project focused on building and testing a practical AI security assessment lab for evaluating LLM defenses against prompt injection and jailbreak attacks.
I integrated Spikee by Reversec with a locally hosted cybersecurity model running through LM Studio, then added NVIDIA NeMo Guardrails to compare model behavior under three conditions: no guardrails, input filtering, and combined input/output protection.
The work included configuring the local model environment, building a custom FastAPI gateway, integrating NeMo Guardrails, troubleshooting model latency and timeout issues, creating a reusable Spikee target, and analyzing attack results using Spikee’s built-in reporting tools.
The project also explored different adversarial testing approaches, including prompt injection datasets, obfuscation, encoded attacks, Best-of-N testing, synthetic canary leakage tests, and structured benchmark comparisons.
The objective was to measure how much the guardrails reduced successful attacks while keeping the model, dataset, and testing conditions consistent.
Tools used: Spikee, NVIDIA NeMo Guardrails, LM Studio, Python, FastAPI, PowerShell, Parrot OS, local LLMs, JSONL datasets, and custom security testing scripts.
This project demonstrates a hands-on approach to LLM red teaming, AI safety testing, prompt-injection assessment, and guardrail validation for organizations deploying generative AI systems.


pretty cool tbh. testing the same attacks with different guardrail setups makes the results way more interesting.