The network for creativity
Join 1.25M professional creatives like you
Connect with clients, get discovered, and run your business 100% commission-free
Creatives on Contra have earned over $150M and we are just getting started
Back to feedPost

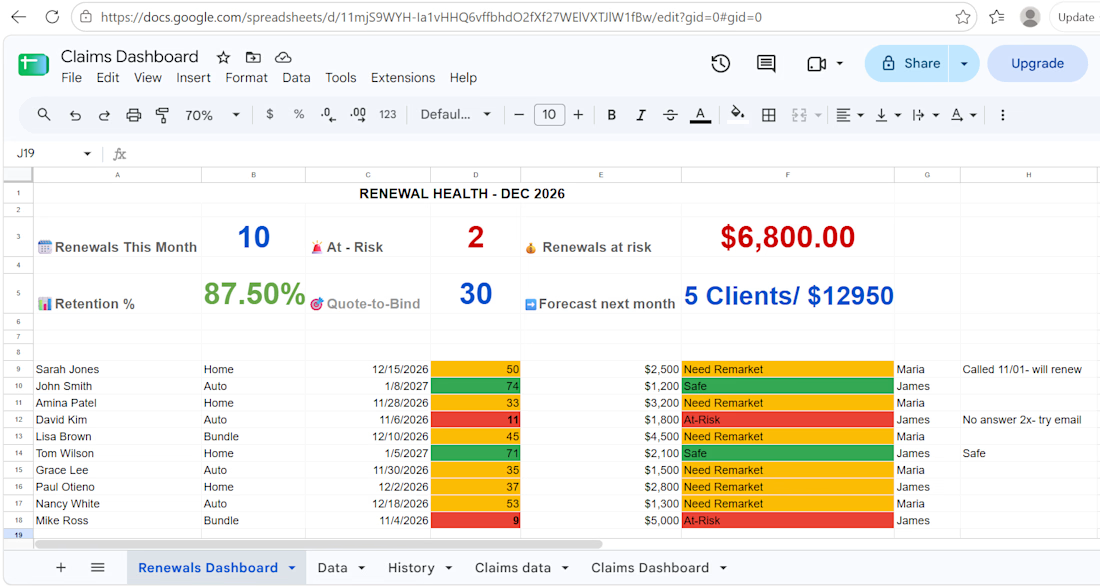
This is a dashboard I created to track renewals data for an insurance company. Clear, direct and easy to understand✨

The network for creativity
Join 1.25M professional creatives like you
Connect with clients, get discovered, and run your business 100% commission-free
Creatives on Contra have earned over $150M and we are just getting started



Related posts

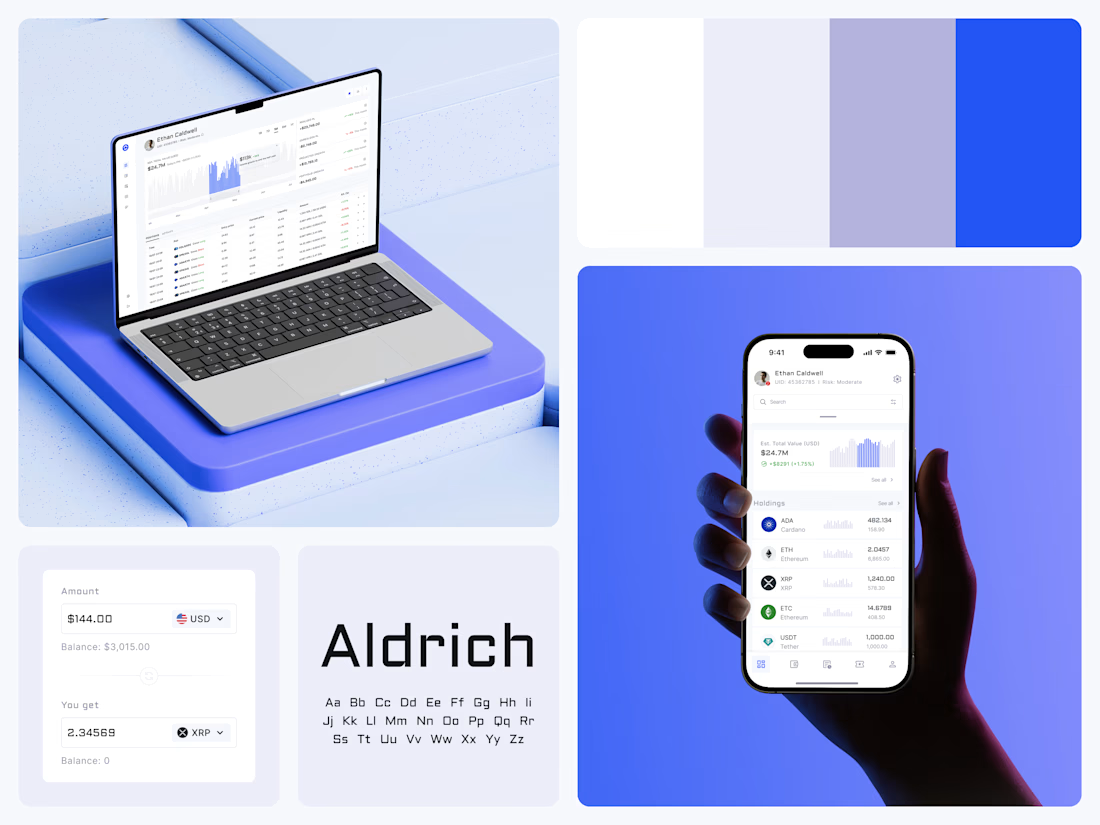
Crypto Portfolio Dashboard
Blue means one thing here: the range you are looking at.
The value chart is a row of thin gray bars, and only the selected date range fills in blue. You read the period that matters and keep the months around it as context.
The phone carries the same chart above the holdings list. Each coin gets its own small bar chart between the name and the amount, so you can scan the whole portfolio for movement without opening a single coin.
Trading screens get busy fast. This one stays light and calm, so the numbers lead: total value, realized and unrealized P&L and open positions, all on one screen.
Designed by the Hue & Machine team.
#Crypto #Fintech #DashboardDesign #TradingPlatform #DataVisualization #UIDesign #ProductDesign #WebApp #MobileDesign #FigmaDesign



Nice Ui Dmytro

Shopify Abandoned Cart Recovery Automation 🛒
Ever wondered how many potential orders an online store could miss when customers add products to their cart but leave without completing checkout?
I built an abandoned cart automation workflow using Activepieces, Shopify, Google Gemini, Gmail, and WhatsApp Business.
⚙️ How It Works
🛒 Cart Trigger: Detects an abandoned checkout event from Shopify.
🔀 Conditional Routing: Routes the workflow based on configured conditions.
🤖 AI-Powered Messaging: Gemini generates a personalized reminder message.
💬 WhatsApp Reminder: Sends a cart reminder through WhatsApp Business.
📧 Email Reminder: Sends a follow-up email to encourage the customer to complete checkout.
💡 How It Can Help E-commerce Businesses
Remind customers about products left in their carts.
Reduce repetitive manual follow-up work.
Make customer communication more consistent.
Create an opportunity to recover potentially lost sales.
Tools Used: Activepieces | Shopify | Google Gemini | Gmail | WhatsApp Business
Project Type: Personal Automation Project
I built this workflow to demonstrate how automation can support abandoned cart recovery for Shopify and D2C businesses.
Interested in automating your store's customer follow-ups? Let's connect.


The 30–60 minute delay then 24-hour follow-up is a sensible cadence. The part I would harden next is the stop conditions: once the cart converts or the customer replies, every channel should cancel, and WhatsApp especially needs a clear opt-in trail before the first send....

MediCore - Dashboard Design in Motion
A dashboard has a lot to communicate. Motion can introduce it one layer at a time.
This MediCore exploration moves from the logo into navigation, key metrics, charts and daily activity- using staged reveals to guide attention through the interface.
A soft teal palette and rounded cards connect the screens, while animated charts bring the data presentation into focus.
A self-initiated dashboard and UI motion concept.
Where does motion add the most value for you: navigation, data visualisation or transitions?

