The network for creativity
Join 1.25M professional creatives like you
Connect with clients, get discovered, and run your business 100% commission-free
Creatives on Contra have earned over $150M and we are just getting started
Back to feedPost
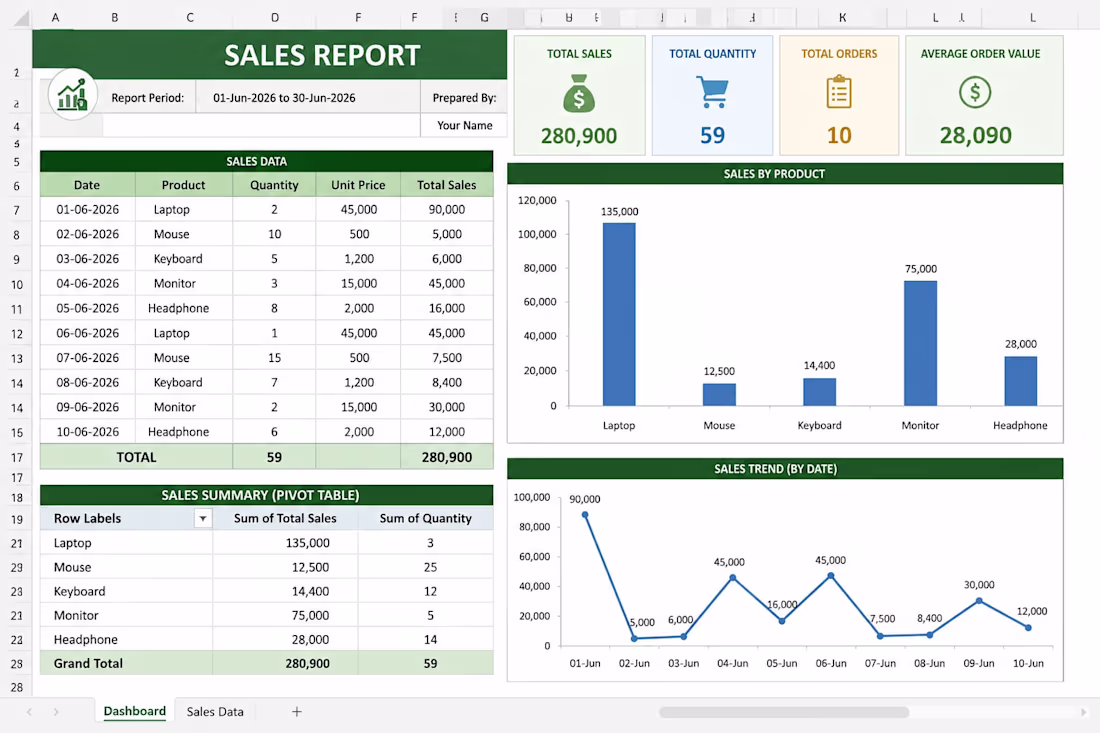
I analyzed a sales dataset using Excel and built a dashboard to track revenue, top products, and monthly trends.
Key insight: A small group of products generated most of the revenue—highlighting clear upsell opportunities.
Tools: Excel (Pivot Tables, Charts)
Open to feedback and data analysis opportunities.
The network for creativity
Join 1.25M professional creatives like you
Connect with clients, get discovered, and run your business 100% commission-free
Creatives on Contra have earned over $150M and we are just getting started
Related posts
Created a professional Excel Sales Dashboard using Pivot Tables, Charts, Data Analysis, and Excel Formulas to track sales performance, product-wise revenue, and sales trends. Designed an interactive and visually appealing report for business decision-making.
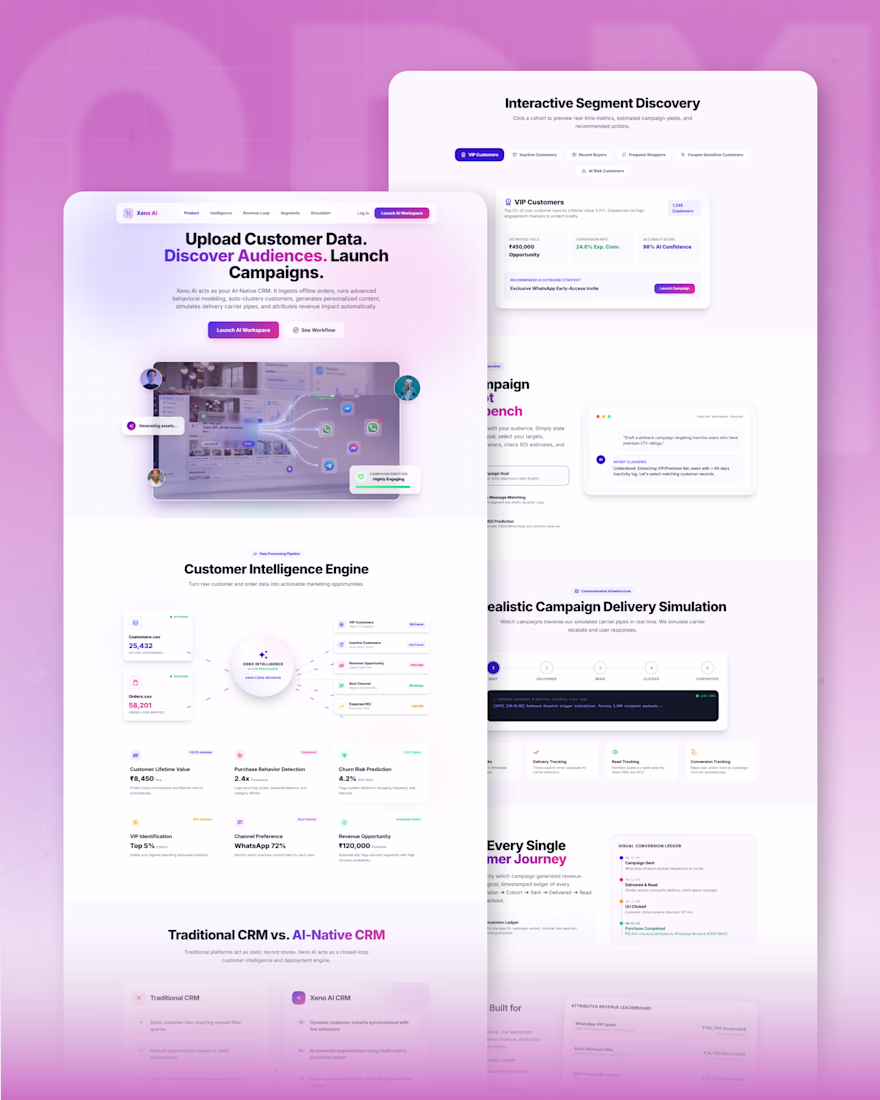
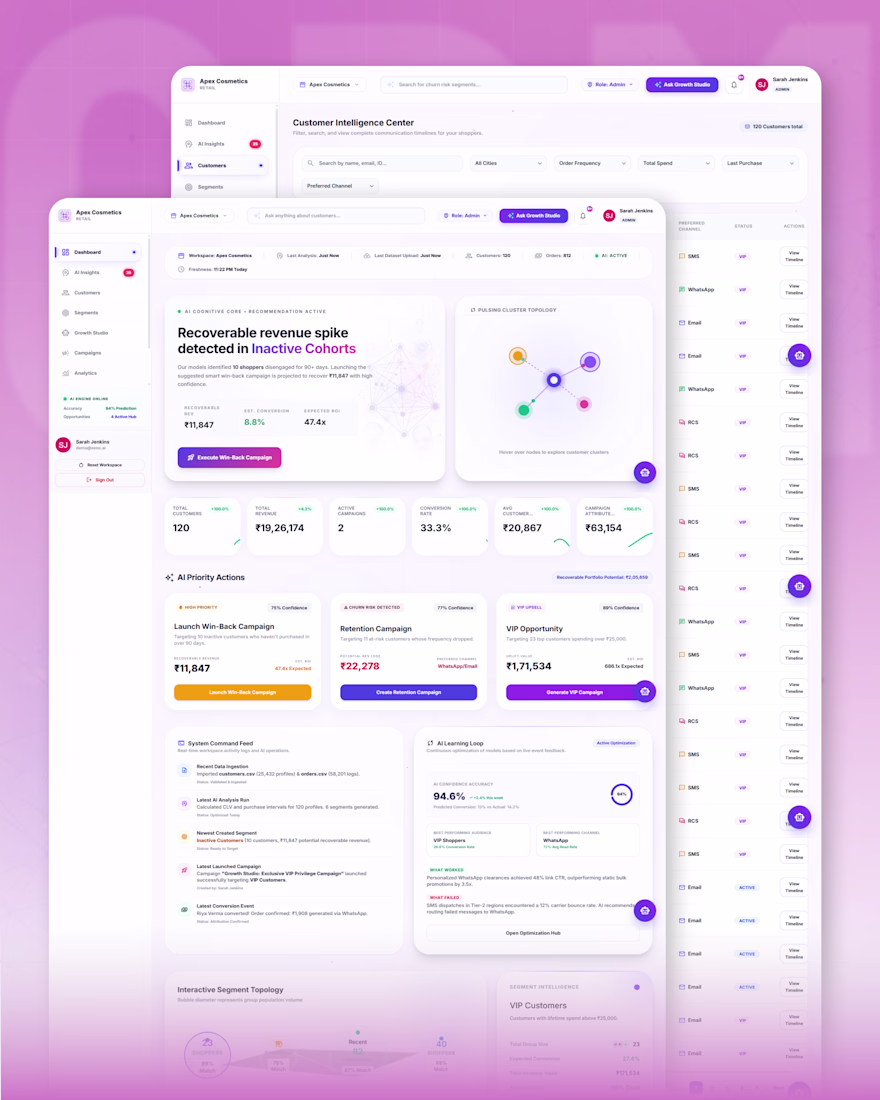
What if customer data didn't just sit inside a CRM?
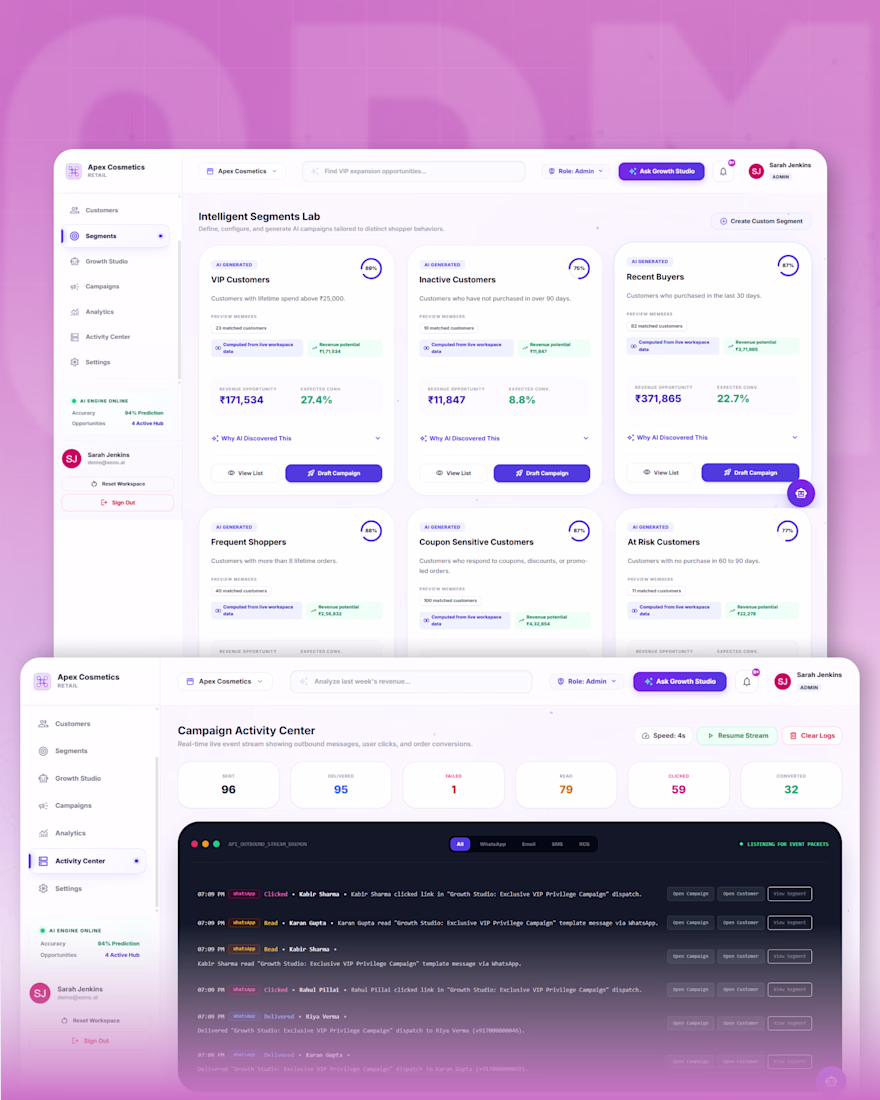
This concept explores an AI-native CRM that turns customer records into audience discovery, revenue opportunities, campaign recommendations, delivery simulations, and attribution insights.
Instead of manually filtering spreadsheets and building segments, the system continuously identifies high-value audiences, predicts opportunities, and suggests the next campaign to launch.
Designed around a simple idea:
Customer Data → Intelligence → Segments → Campaigns → Revenue
Exploring how AI could transform CRM from a database into a growth engine.
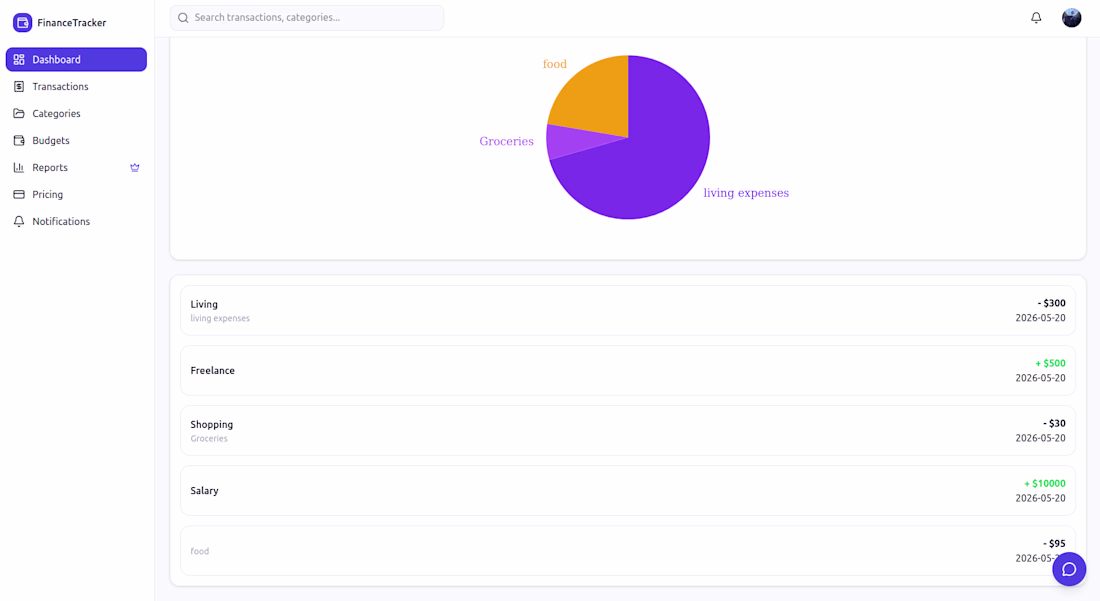
FinanceTracker is an enterprise-grade personal finance ecosystem designed to monitor multi-user activity, handle budgeting, and deliver real-time financial reporting.
Key Contributions:
High-Performance Analytics: Engineered optimized MongoDB Aggregation Pipelines to process complex multi-user data with a sub-350ms response time across 10,000+ transaction records
Enterprise Analytics Engine: Developed real-time data visualization frameworks for categorization breakdowns, live activity monitoring, and custom transaction reporting.
Secure Architecture: Built a layered MVC structure secured with robust JWT authentication to handle multi-user tenant isolation smoothly.::
Trending
Claude
Claude has entered the design space. How are you using Claude Design?
Contra University
Learn from expert creatives how to earn more using next-gen AI tools.
MagicPath
The canvas is infinite, and exploration is becoming the workflow. How are you using MagicPath?
creativeaiflow
Creative AI workflows are evolving. What tools do you use, and what are their strengths and weaknesses?
freelancerlife
Freelancer life is wins, pivots, and everything in between. What’s yours right now?