The network for creativity
Join 1.25M professional creatives like you
Connect with clients, get discovered, and run your business 100% commission-free
Creatives on Contra have earned over $150M and we are just getting started
Back to feedPost

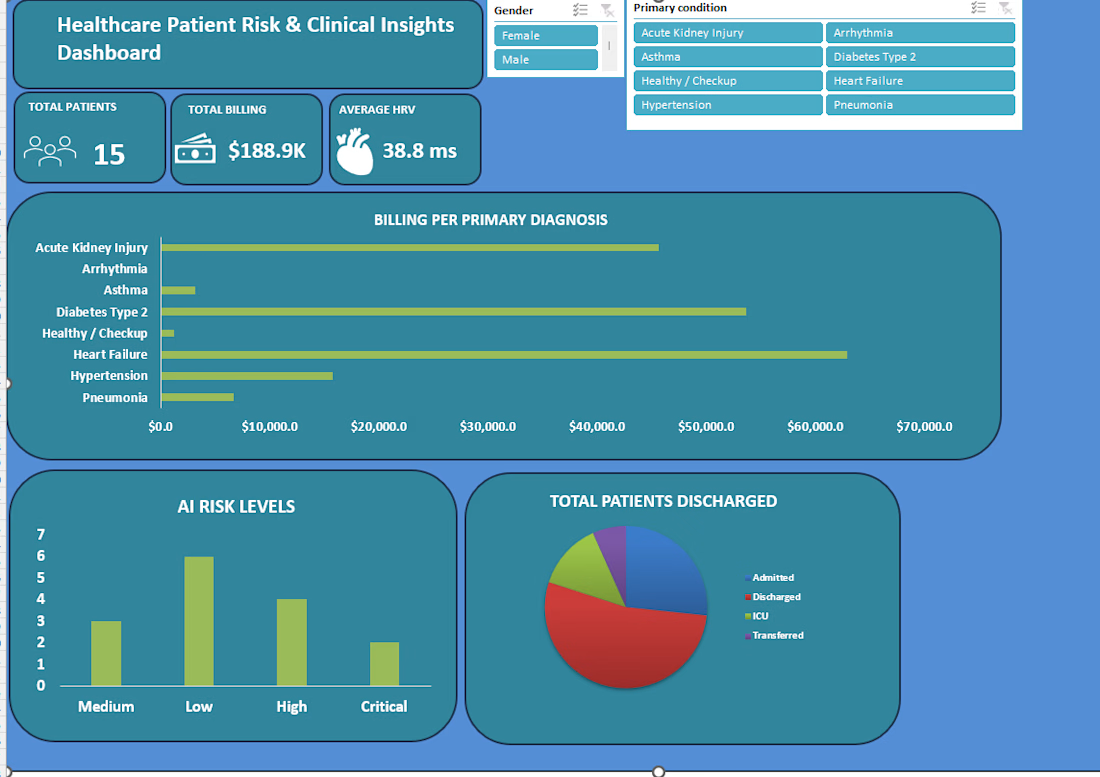
Project Summary: Healthcare Patient Risk & Telemetry Insights
This analysis covers a dataset of 15 patient admissions, evaluating the links between clinical primary conditions, financial billing, AI risk stratification, and wearable IoT device sync performance.
Key Financial & Operational Highlights
Total Billed Revenue: $188,852.00 across all recorded patient admissions.
Average Cost Per Admission: $12,590.13 across all 15 cases (or $15,737.67 when excluding pending or unbilled accounts).
Unbilled / Pending Accounts: 3 out of 15 records (20%) show $0 billed amounts due to pending claims or missing telemetry data audits (Patients P-1005, P-1010, and P-1015).
Highest Revenue Drivers: Heart Failure ($62,900.00 total across 2 patients) and Diabetes Type 2 ($53,600.00 total across 3 patients) account for 61.7% of total revenue. A single Acute Kidney Injury case represents the highest individual charge at $45,600.75.
Primary Condition & Revenue Breakdown
Hypertension: 4 Patients | $15,751.00 Total Revenue | $3,937.75 Average | Low Risk (75%)
Diabetes Type 2: 3 Patients | $53,600.00 Total Revenue | $17,866.67 Average | High / Medium Risk
Heart Failure: 2 Patients | $62,900.00 Total Revenue | $31,450.00 Average | Critical Risk (100%)
Asthma: 2 Patients | $3,100.25 Total Revenue | $1,550.13 Average | Low / Medium Risk
Acute Kidney Injury: 1 Patient | $45,600.75 Total Revenue | $45,600.75 Average | High Risk (Sepsis Protocol)
Arrhythmia: 1 Patient | $0.00 Total Revenue (Pending) | $0.00 Average | High Risk (Cardiac Event)
Pneumonia: 1 Patient | $6,700.00 Total Revenue | $6,700.00 Average | Medium Risk
Healthy Checkup: 1 Patient | $1,200.00 Total Revenue | $1,200.00 Average | Low Risk
AI Risk Stratification & Clinical Alerts
Low Risk: 6 Patients (40.0%) | Standard hypertension, routine asthma, and checkup cases.
Medium Risk: 3 Patients (20.0%) | Stable monitoring for pneumonia and managed conditions.
High Risk: 4 Patients (26.7%) | Directly tied to urgent clinical triggers including Anomalous Spike (P-1002), Sepsis Protocol (P-1006), and Cardiac Event (P-1015).
Critical Risk: 2 Patients (13.3%) | Heart failure cases (P-1003 and P-1011) requiring immediate ICU transfer and continuous cardiology telemetry.
Wearable Tech / Telemetry Performance
Sync Success Rate: 13 out of 15 devices (86.7%) successfully synced Heart Rate Variability (HRV) and sleep efficiency scores.
Device Failures: 2 devices (13.3%) faced connection issues. Patient P-1002 experienced a Partial Sync that hid metrics during an AI spike flag, while Patient P-1005 was completely Offline.
Actionable Recommendations for the Team
Standardize ICU Alerts: Establish immediate transfer protocols for heart failure patients presenting with HRV levels under 20ms.
Resolve Pending Claims: Audit the 3 zero-dollar/pending accounts to prevent revenue leakage.
Telemetry Checkpoints: Implement a pre-discharge checklist ensuring wearable sync verification before sending high-risk cardiovascular or diabetic patients home.

The network for creativity
Join 1.25M professional creatives like you
Connect with clients, get discovered, and run your business 100% commission-free
Creatives on Contra have earned over $150M and we are just getting started

Challenges
View all


Related posts

CrowdStrike Investor Pitch Deck Design
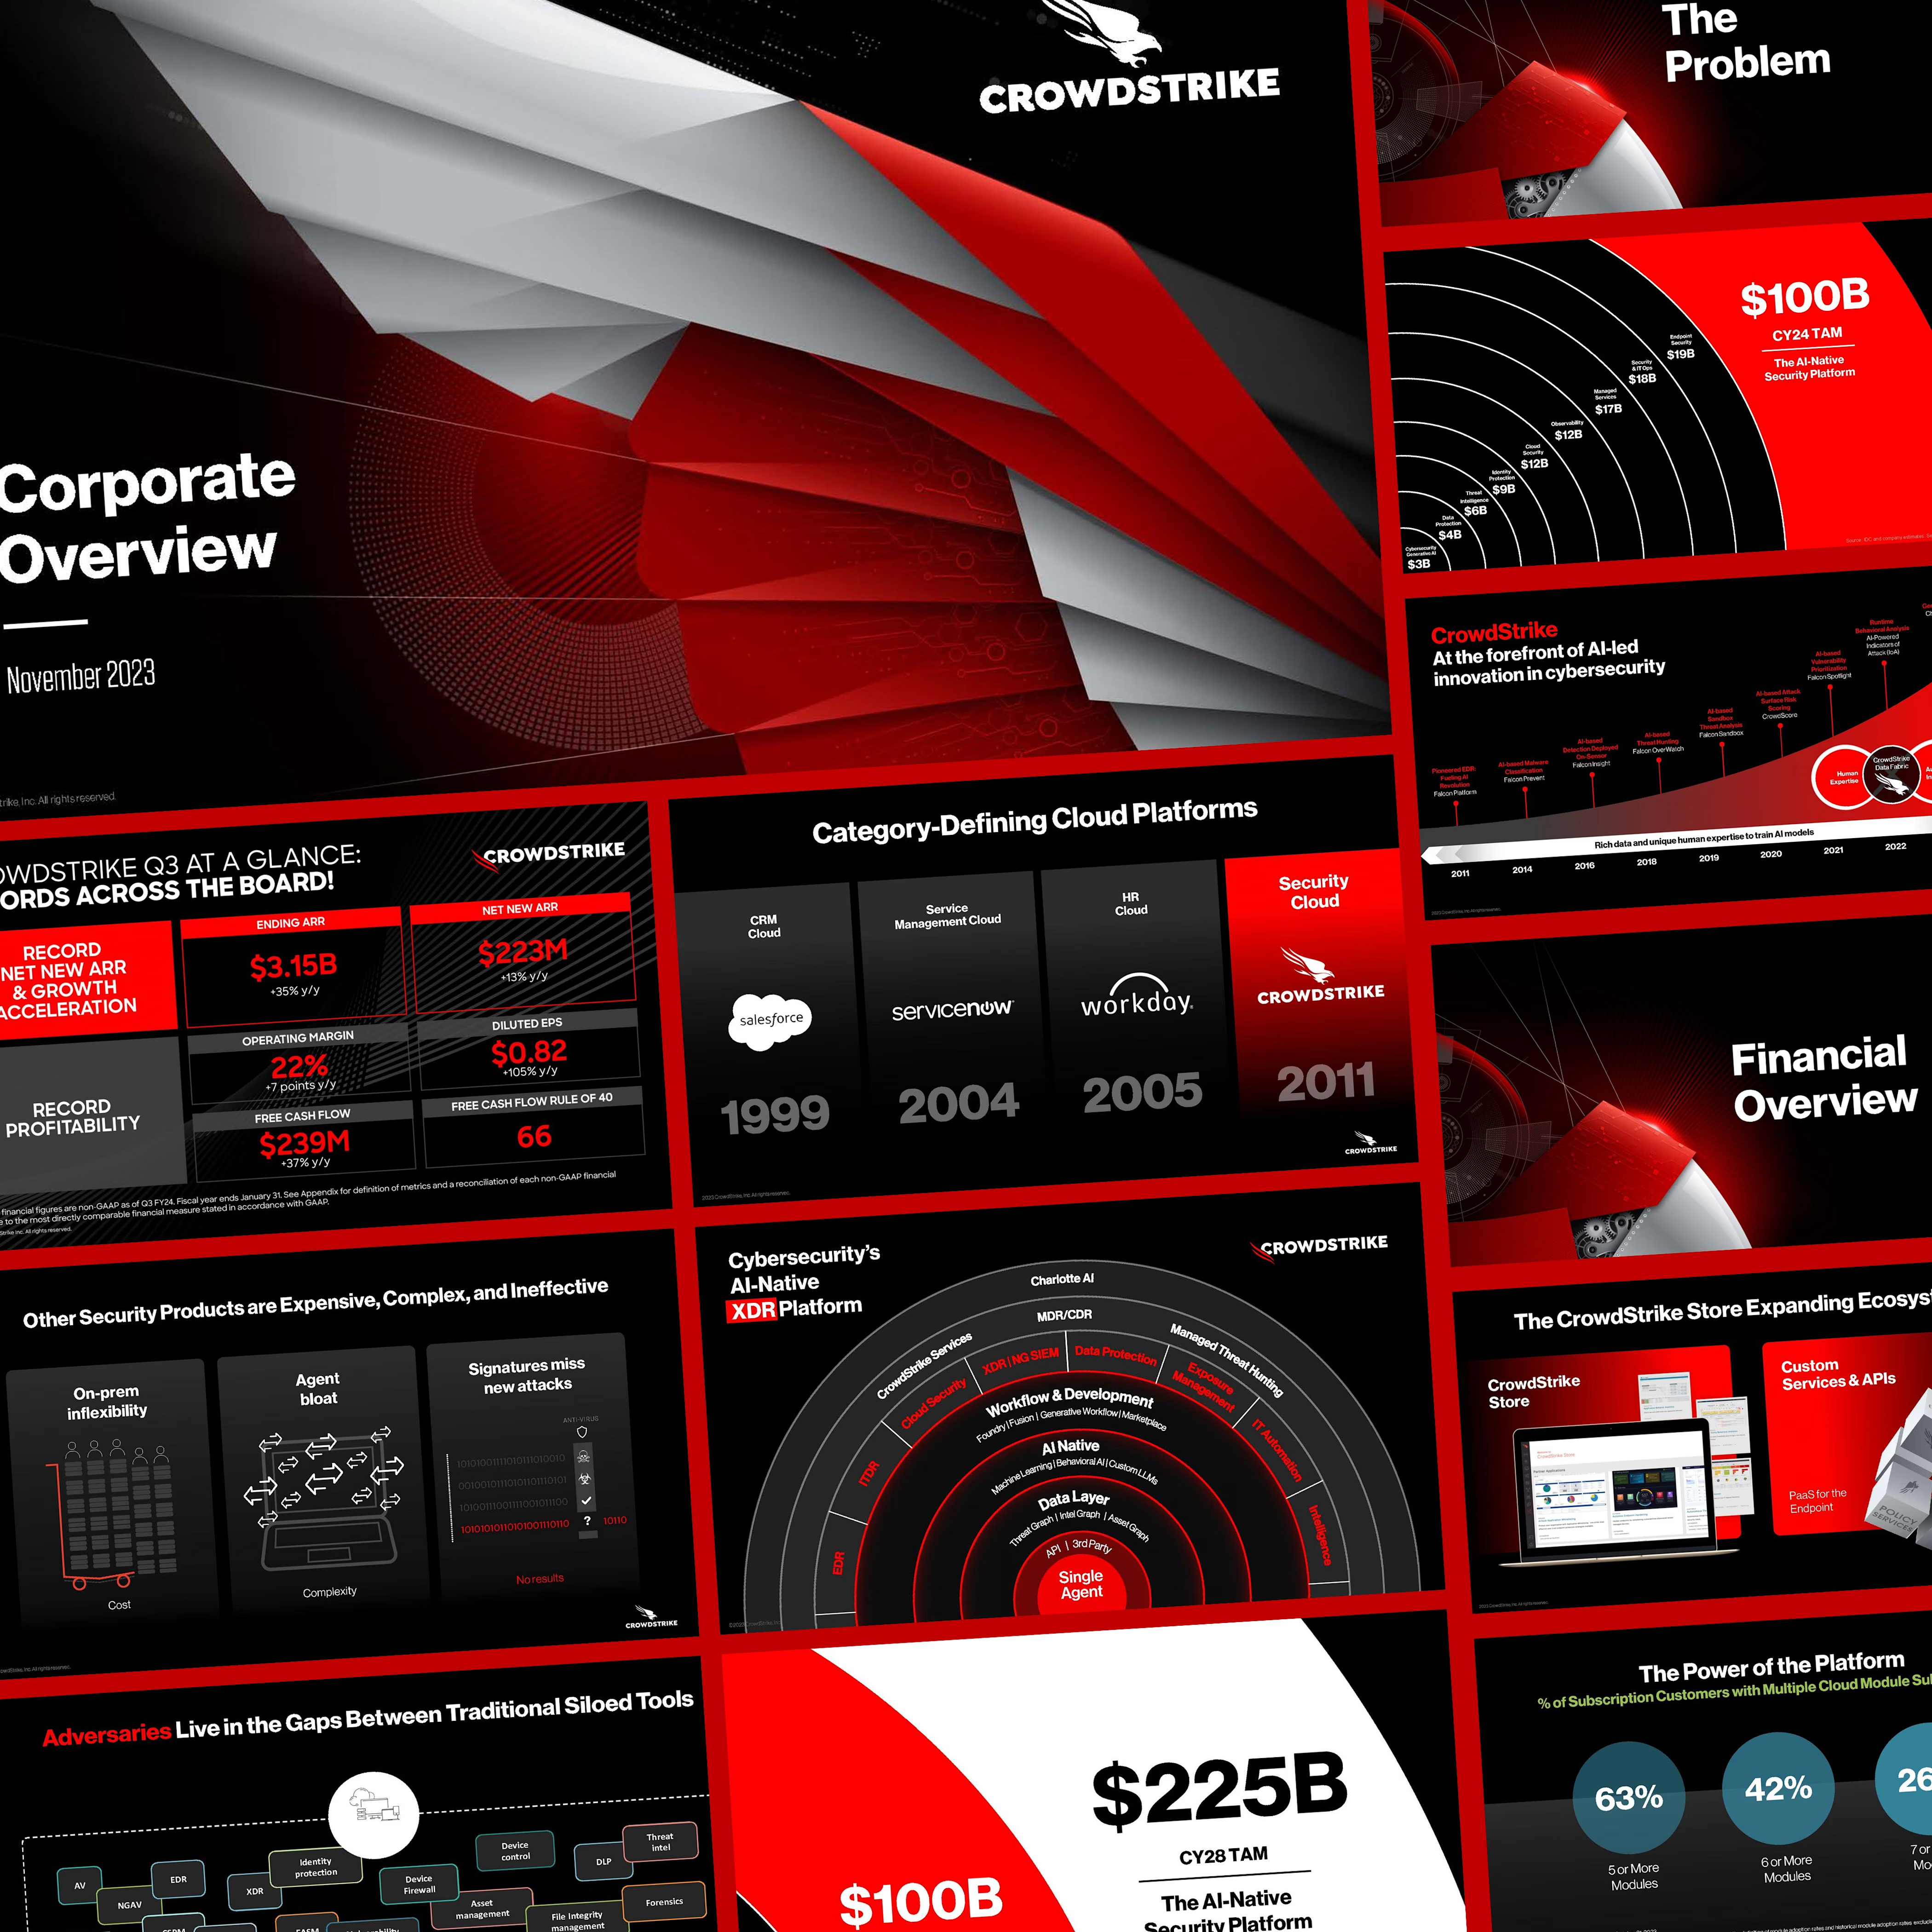
Presenting a bold, high-impact Corporate Overview deck inspired by CrowdStrike's brand identity — clean red & black theme, sharp geometric visuals, and data-driven storytelling.
This deck covers:
📌 Company snapshot & Q3 highlights (record revenue growth, ARR, profitability)
📌 Category-defining cloud platforms timeline (1999–2011)
📌 The Problem — $100B cyber threat landscape
📌 AI-native XDR platform overview
📌 Financial overview & $225B TAM breakdown
📌 CrowdStrike Store & partner ecosystem
📌 Power of the platform — module adoption stats
A perfect example of how strong visuals + structured data can turn a corporate overview into a compelling brand story. 🚀
#CrowdStrike #CorporateOverview #Cybersecurity #PitchDeck #PresentationDesign #GraphicDesign #BrandIdentity #BusinessPresentation #SlideDesign #DataVisualization #CorporateBranding #DesignInspiration #FinancialOverview #TechDesign #CreativeDesign

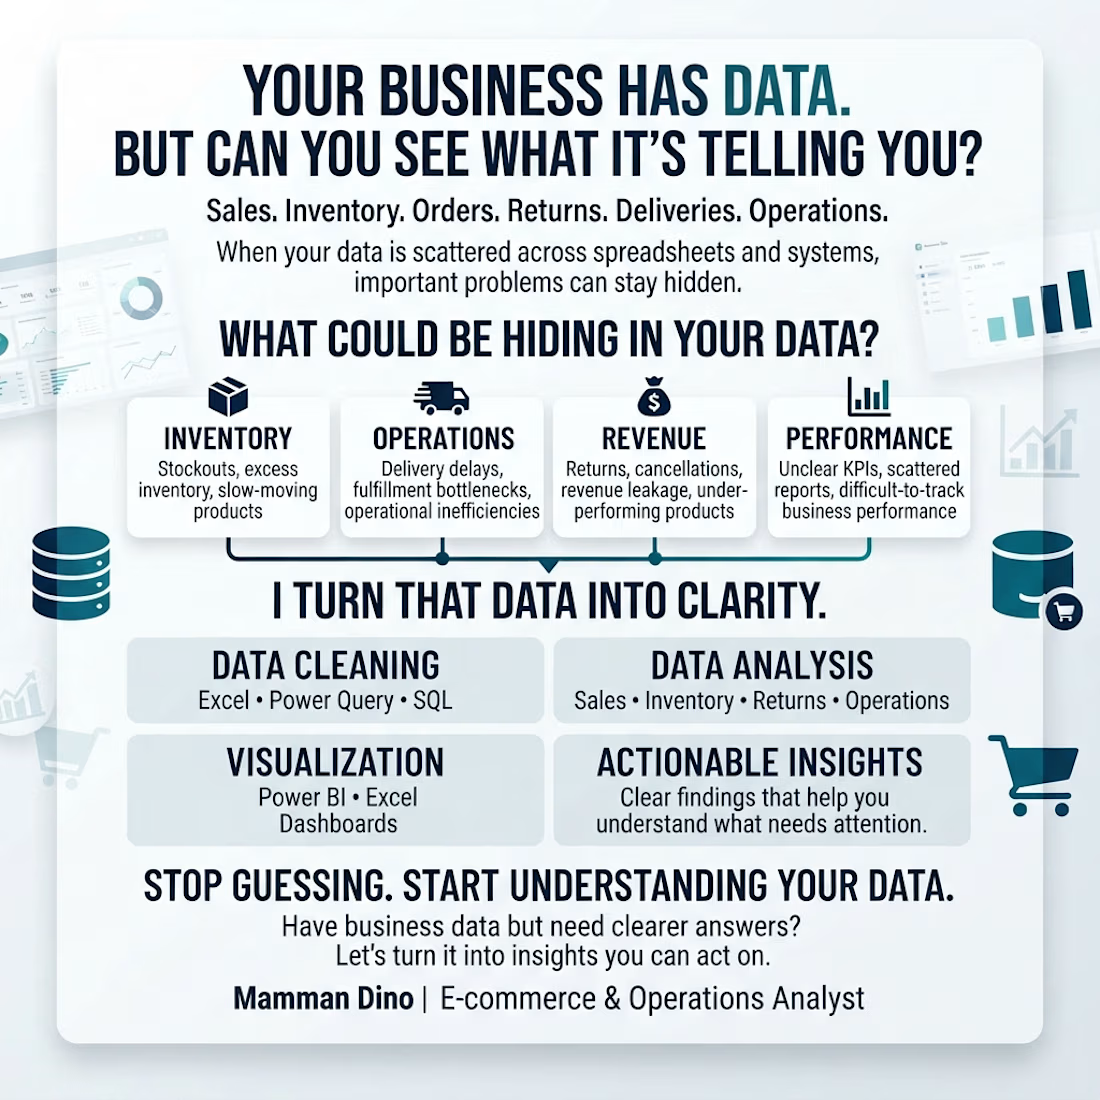
Your business is generating data every day.
But can you quickly answer:
📦 Which products are at risk of stockouts?
🚚 Where are delivery and fulfillment problems happening?
💰 Which products or processes are affecting revenue?
📊 Which numbers actually need your attention?
That’s where I come in.
I help e-commerce and operations businesses clean, analyze, and visualize their data using Excel, Power Query, SQL, and Power BI.
The goal isn't just another dashboard.
It’s clearer answers, better visibility, and insights you can act on.
If your business has data but you're struggling to turn it into decisions, let's talk.
#Ecommerce #Operations #DataAnalytics #PowerBI #SQL #Excel #BusinessIntelligence

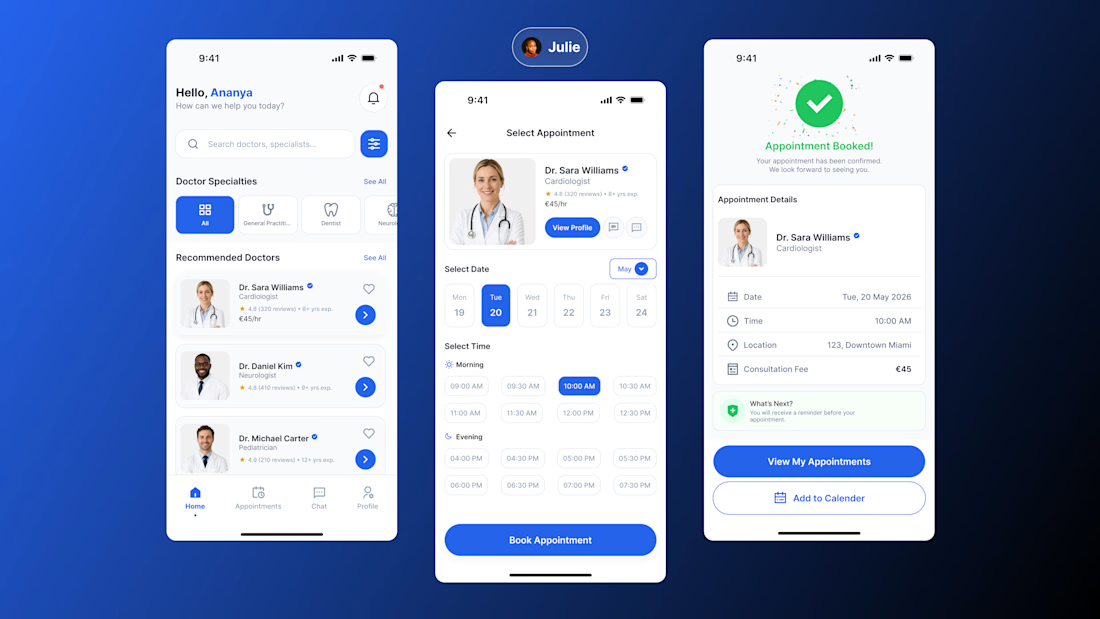
A healthcare appointment experience.
I’m currently designing a mobile experience that makes finding the right specialist and booking an appointment feel simple and straightforward.
So far, I’ve worked through the doctor discovery, specialist selection, date & time selection, and booking confirmation screens.
My focus is on reducing friction, keeping the information easy to scan, and making each step feel clear before moving to the next.
Still working on the full experience though.
Designed in Figma.


PRO Design 😍