The network for creativity
Join 1.25M professional creatives like you
Connect with clients, get discovered, and run your business 100% commission-free
Creatives on Contra have earned over $150M and we are just getting started
Back to feedPost
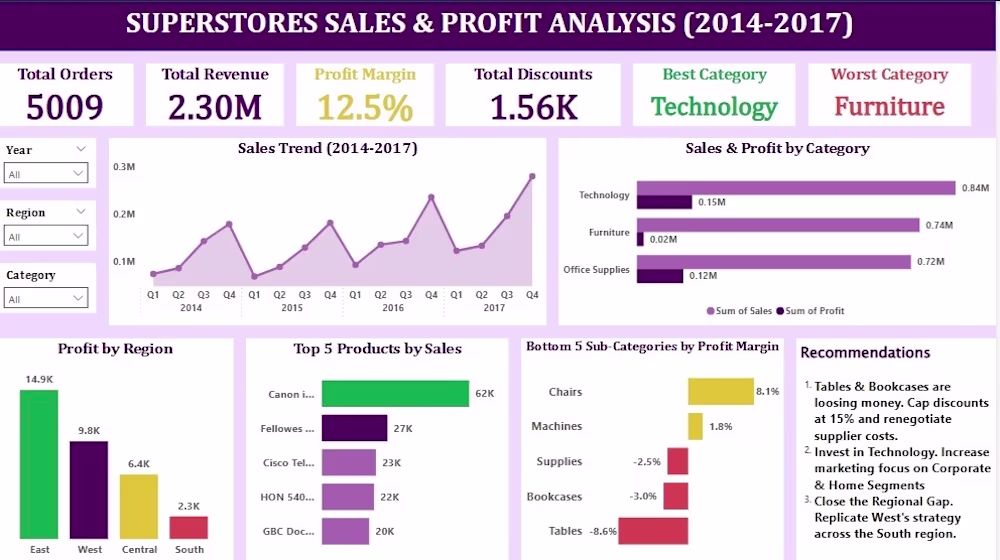
A store made $2.3M in revenue and was still losing money. Here’s where it was going wrong.
I built a Sales & Profit Analysis dashboard covering 4 years of data
And the numbers told a story revenue alone would never show.
The findings:
📍Furniture had $740K in sales but only $20K in profit
📍Tables and Bookcases had negative margins which means selling more meant losing more
📍The South region was bleeding compared to every other region
📍Technology was quietly carrying the entire business
The fix wasn’t complicated once the data was clear:
✅Reduce Furniture discounts and renegotiate supplier costs
✅Invest more in Technology since it’s already winning
✅Study the West region and replicate it in the South
That’s what a good dashboard does.
Not just show numbers
It shows you exactly where to act.
This dashboard was built with Power BI.
The hardest part was knowing which questions to ask before touching the tool.
What’s one business decision in your industry that data could make obvious but most people still make on gut feeling?
The network for creativity
Join 1.25M professional creatives like you
Connect with clients, get discovered, and run your business 100% commission-free
Creatives on Contra have earned over $150M and we are just getting started
Related posts
📊 Project Title: Sales Performance & Regional Analytics Dashboard
Project Overview
Developed an interactive Power BI dashboard to analyze sales KPIs, product distribution, and agent performance across key regional markets. The dashboard translates raw sales metrics into actionable insights, enabling stakeholders to monitor volume goals, track geographic purchasing power, and evaluate individual sales distributions.
Key Features & Metrics Tracked
KPI Scorecards: Real-time tracking of high-level metrics including Total Purchase Amount ($29.78M), Total Quantity Sold (73K), and total transaction counts.
Goal & Target Tracking: A dynamic Gauge chart monitoring total product counts against a benchmark goal of 5,492, showing an impressive +5% variance over target performance.
Geographic Analysis: A bar chart mapping the Average Purchase Amount by City, highlighting customer purchasing behavior across major hubs like Benin, Lagos, and Abuja.
Sales Agent Distribution: Interactive slicers paired with a donut chart breakdown (Count of City by Name) to isolate and evaluate individual sales contributions (e.g., Anna, David, Grace, Mary, Paul).
Tech Stack
Tool: Power BI Desktop
Data Visualization: Custom KPIs, Gauge charts, Donut charts, Scatter/Line plots, and Interactive Slicers for deep-dive filtering.
Power BI Dashboards done on: Organizational Dimensions, Compensation, RPA follow up
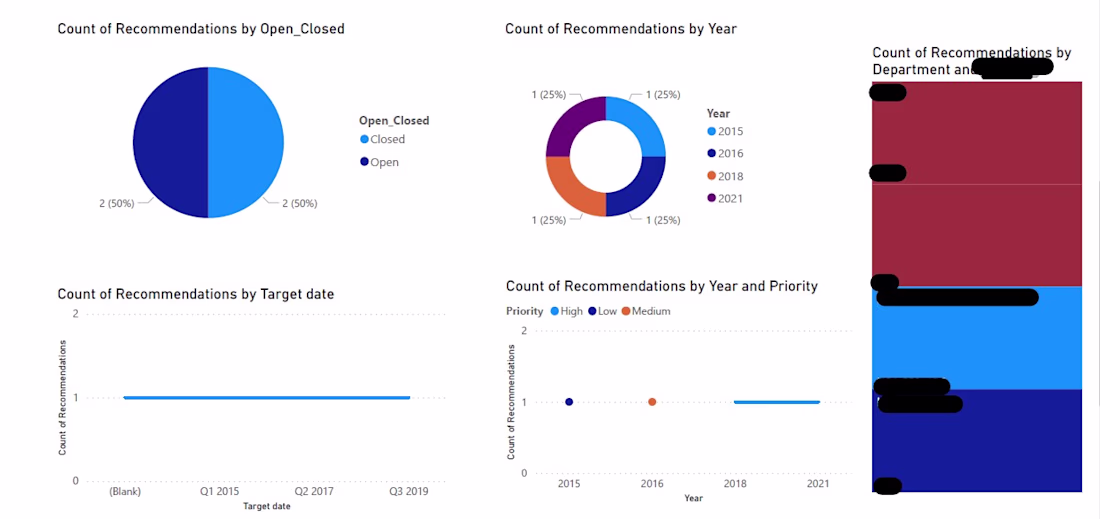
Challenges
View allTrending
Claude
Claude has entered the design space. How are you using Claude Design?
Contra University
Learn from expert creatives how to earn more using next-gen AI tools.
creativeaiflow
Creative AI workflows are evolving. What tools do you use, and what are their strengths and weaknesses?
portfolioreview
The best portfolios tell a story, not just show a grid. Share yours for feedback.
freelancerlife
Freelancer life is wins, pivots, and everything in between. What’s yours right now?