
Lucky Silver
Transforming messy numbers into compelling narratives that h
New to Contra
Lucky is building their profile!
📊 Banking & Sales Insights Dashboar
The Project
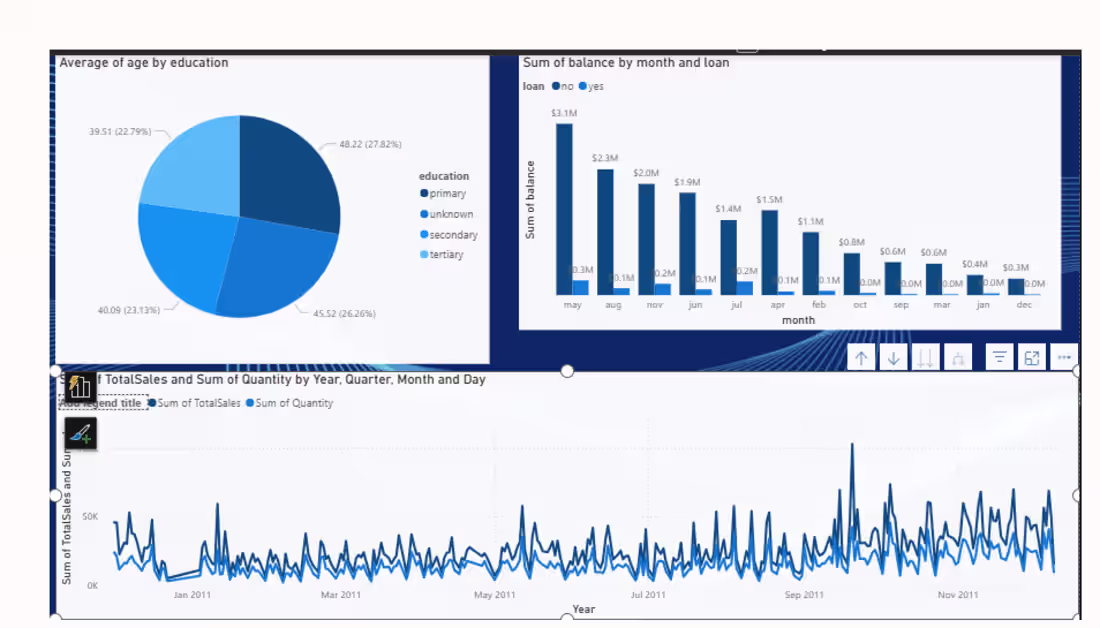
I built this dashboard to connect customer demographics with real financial behavior. The idea was to look past just the sales numbers and see how factors like education, loans, and seasonality actually impact account balances and daily revenue trends.
Key Highlights:
Demographics: Mapped out customer age and education levels to see exactly who the core audience is.
Loan & Balance Trends: Tracks monthly account balances, highlighting a massive $3.1M peak in May and revealing how holding a loan changes a customer's savings habits.
Daily Sales Tracking: A detailed time-series line chart tracking sales volume and quantities over an entire year to spot seasonal spikes at a glance.
0
2
📈 2026 Product Revenue Performance Dashboard
The Project
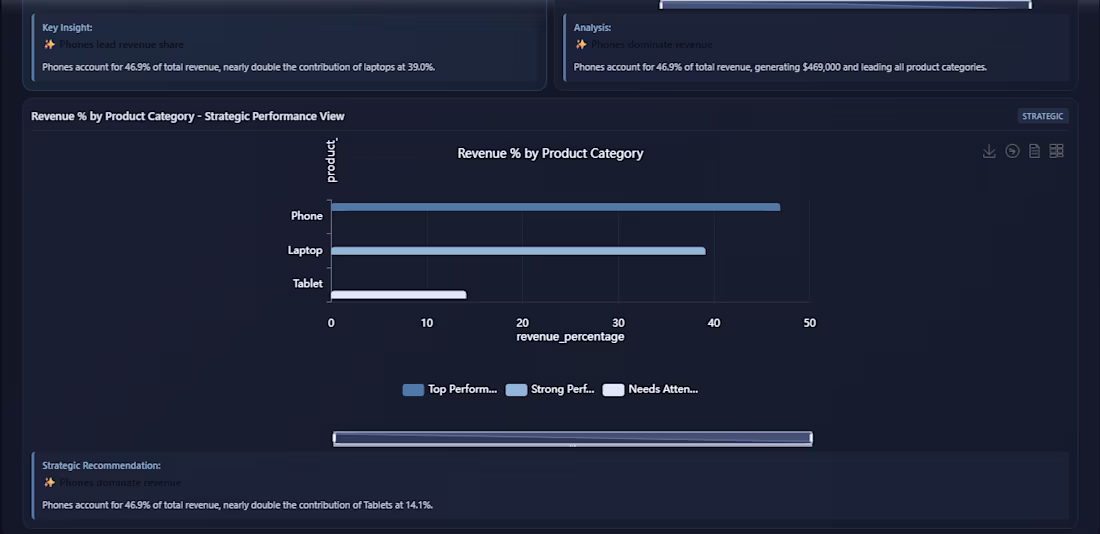
I built this executive dashboard to turn raw sales data into an instant health check for a $1.0M product portfolio. Instead of just throwing charts on a screen, I designed it to automatically highlight what the numbers actually mean for business strategy.
Key Highlights:
Instant KPI Tracking: Showcases a high-level view of $1.0M in total revenue across 3 product lines for the 2026 fiscal year.
Smart Data Layouts: Visualizes performance through dual views—using a clean donut chart for overall revenue split and a streamlined bar chart for strategic review.
Built-in Strategic Insights: Features dedicated sections that call out critical trends—like pointing out that Phones generate $469K (46.9% of revenue), nearly doubling the contribution of Tablets.
Actionable Buckets: Categorizes products into clear segments (Top Driver, Strong Performer, Growth Opportunity) so managers know exactly where to focus resources.
0
6
📊 Project Title: Sales Performance & Regional Analytics Dashboard
Project Overview
Developed an interactive Power BI dashboard to analyze sales KPIs, product distribution, and agent performance across key regional markets. The dashboard translates raw sales metrics into actionable insights, enabling stakeholders to monitor volume goals, track geographic purchasing power, and evaluate individual sales distributions.
Key Features & Metrics Tracked
KPI Scorecards: Real-time tracking of high-level metrics including Total Purchase Amount ($29.78M), Total Quantity Sold (73K), and total transaction counts.
Goal & Target Tracking: A dynamic Gauge chart monitoring total product counts against a benchmark goal of 5,492, showing an impressive +5% variance over target performance.
Geographic Analysis: A bar chart mapping the Average Purchase Amount by City, highlighting customer purchasing behavior across major hubs like Benin, Lagos, and Abuja.
Sales Agent Distribution: Interactive slicers paired with a donut chart breakdown (Count of City by Name) to isolate and evaluate individual sales contributions (e.g., Anna, David, Grace, Mary, Paul).
Tech Stack
Tool: Power BI Desktop
Data Visualization: Custom KPIs, Gauge charts, Donut charts, Scatter/Line plots, and Interactive Slicers for deep-dive filtering.
1
12