
Ciro
Go to sleep, may your sweet dreams come true...
Ready for work
Ciro is ready for their next project!
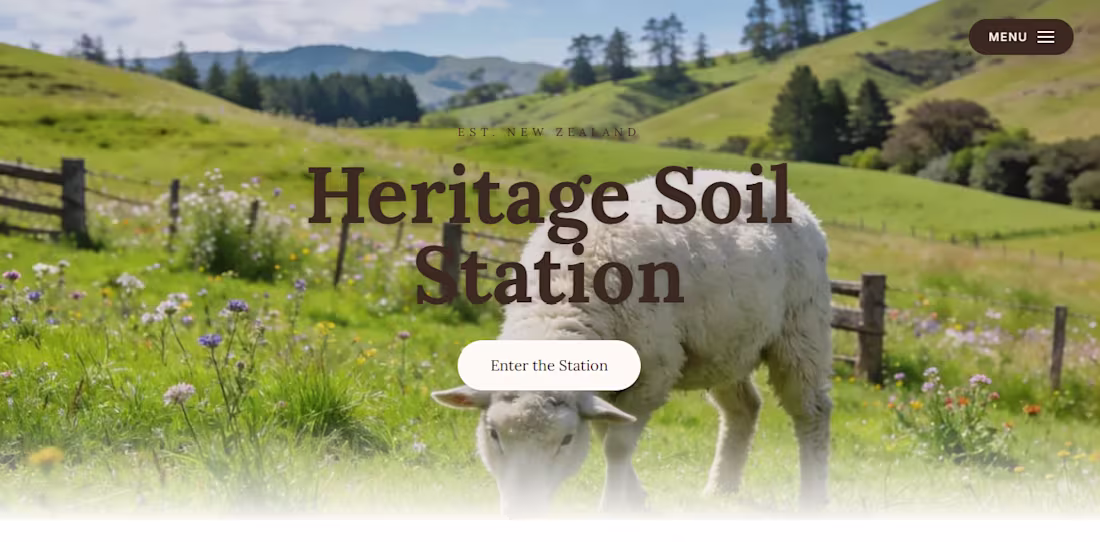
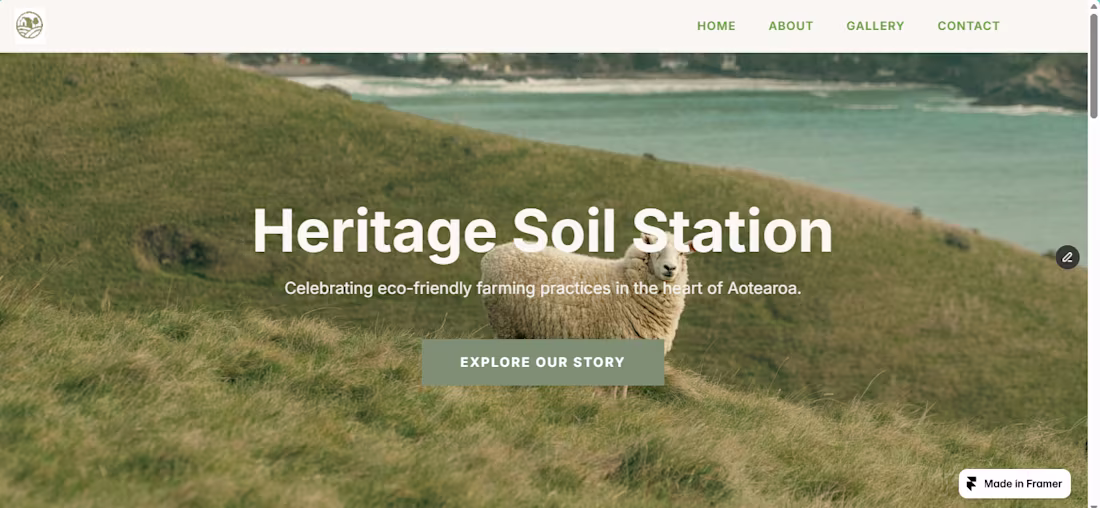
Heritage Soil Station: A NZ Website
5
13
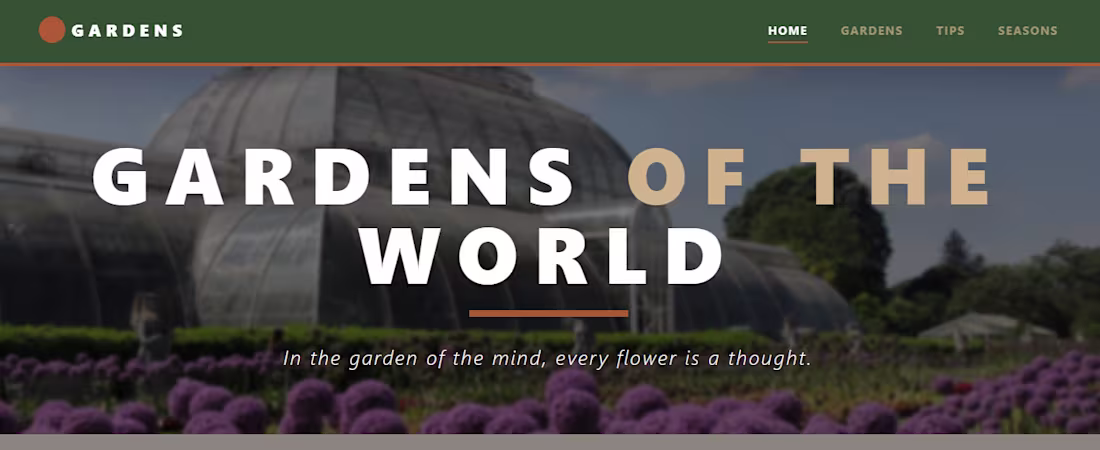
Gardens of the World: Full-Stack Web App/Website
6
14
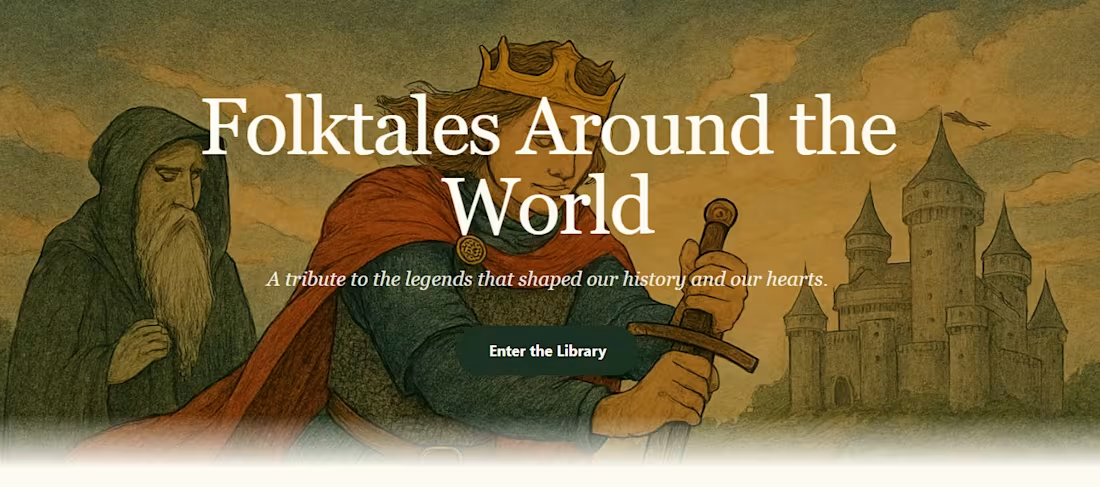
Folktales Around the World: Full-Stack Web App/Website
6
13
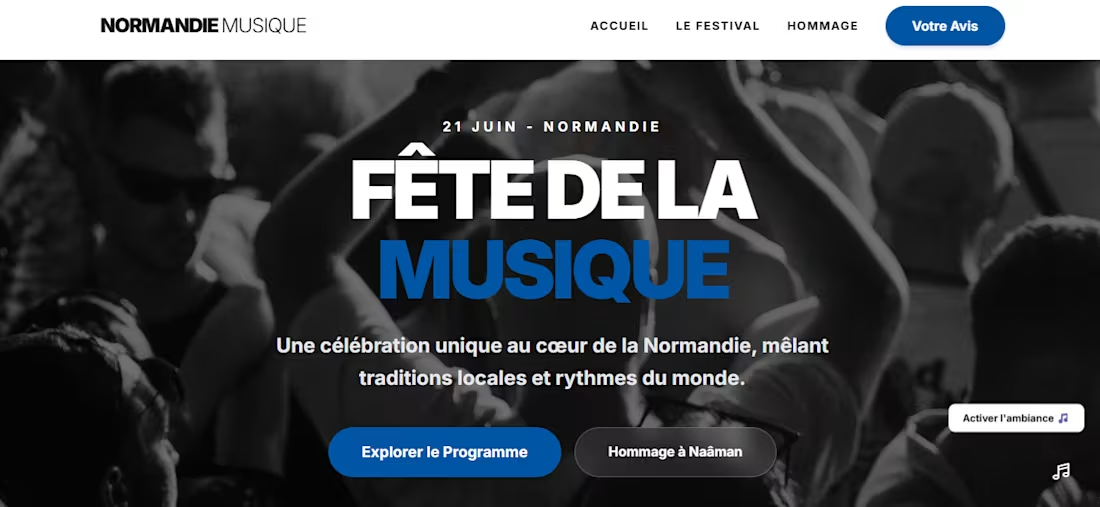
Fête de la Musique Web App/Website: Tribute to Naâman
5
11
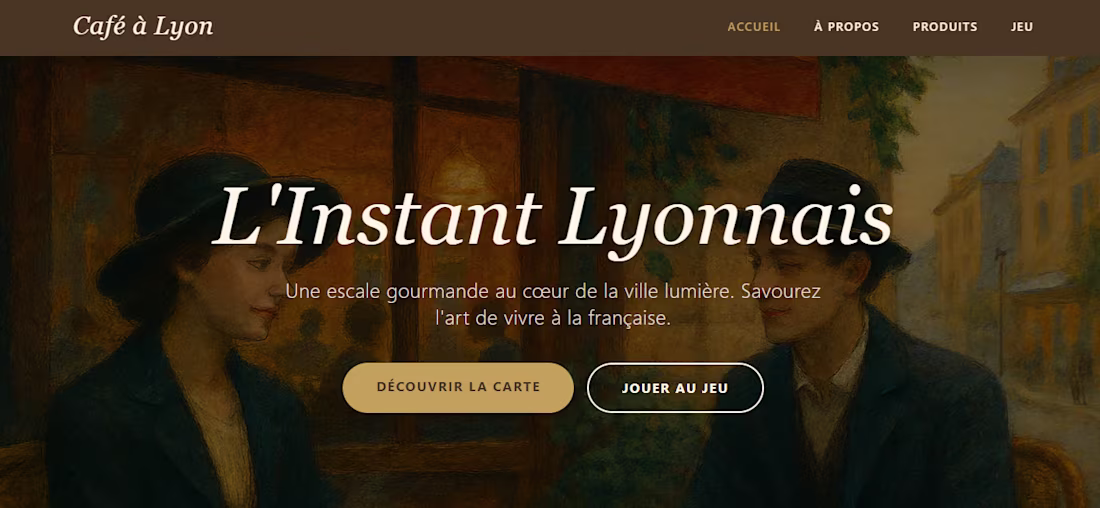
Café à Lyon: A Sweet and Interactive App/Website
4
8
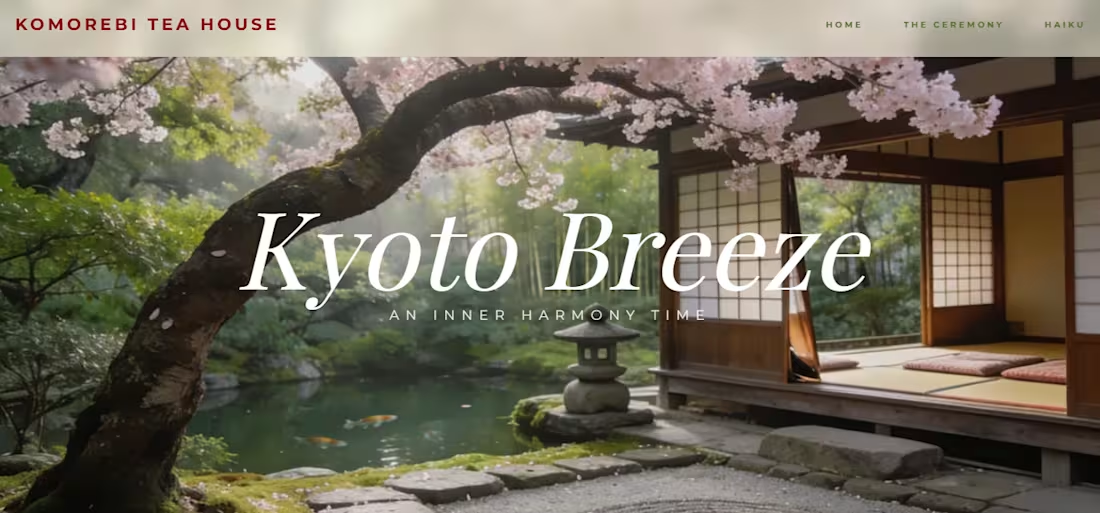
Komorebi Tea House: A Peaceful and Calm App/Website
4
8
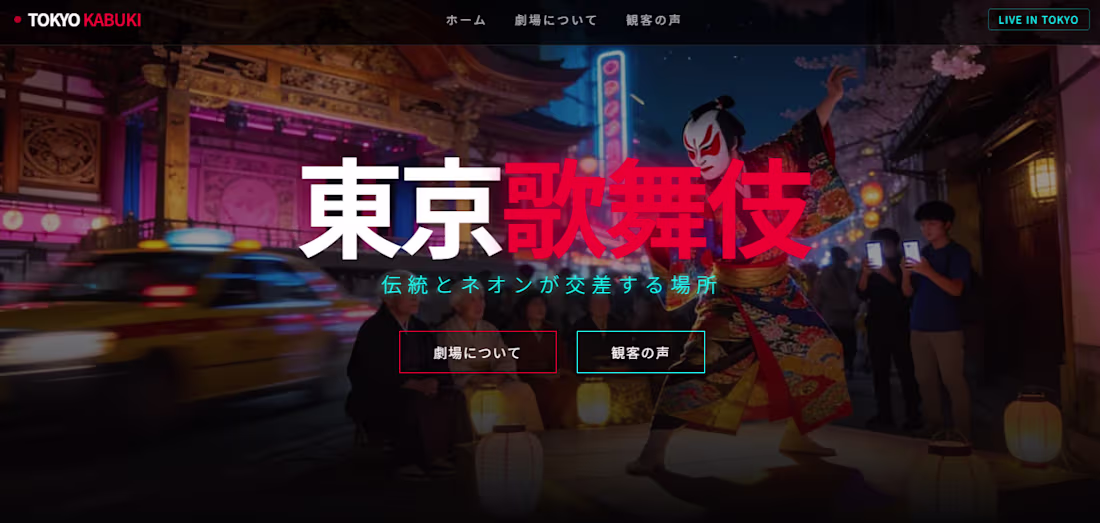
Kabuki Theatre Website
3
7
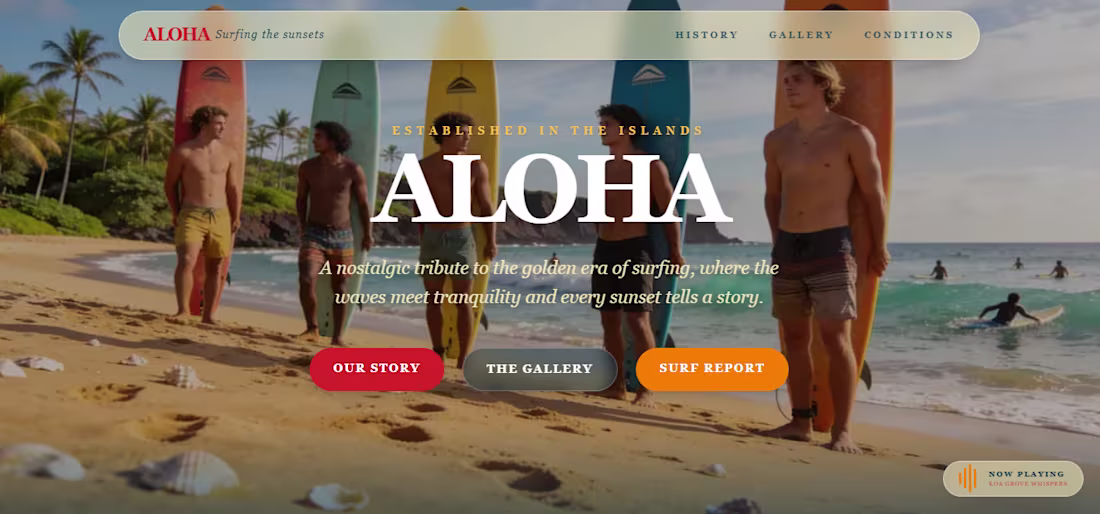
Surfing in Hawaii: A Hawaiian Rollercoaster Tribute Website
3
4
Café à Lyon App Development
Choosing Lyon for this project was not a random decision, but rather rooted in a distant souvenir, perhaps a postcard of what might have been, but never was. I chose calm, coffee-like colors such as shades of brown and cream, an elegant typography. Creating this app was a mix of writing code, compassing the design, and also with a spoonful of nostalgia and a mellow mood.
I worked with TypeScript, React, among other tools, such as Lummi for generating more than 25 images. I also created a flipping-card game in one of the sections, which you can see here.
This is also my final project of February, and what a way to end it! Choosing one of my favorite destinations along with a fascinating topic!
You can read the whole process here (https://contra.com/p/OqWPQgLm-cafe-a-lyon-creating-a-simple-app)
4
5
344
A couple of days ago, I was replying to a post by @Anton Zalis and made me realize something: I shouldn't leave my first projects in the attic gathering dust; stick to what you already know.
This project is actually an improvement of the very first project I ever made with Python: a Word Analyzer. Users can insert text to find the total word count and identify the most frequently used words. I’ve added a toggle to exclude common 'stopwords' (like 'the', 'a', etc.) and included buttons to export reports in both CSV and PDF formats.
For the frontend, I opted for clear, pastel colors instead of a dark mode. The sun is shining today, and I felt inspired to create something bright. Hope you like it!💚
18
41
1.8K
Years ago, while studying Agroecology, I was introduced to diverse farming landscapes across the globe, from the tropical fields of Brazil to the lush pastures of New Zealand.
This mobile app is a minimalist tribute to the countryside. Built with React Native, NativeWind, and Expo, I focused on creating a layout that matches the "earthy vibration" of the farm.
This project is proof that creating an app doesn't have to be overwhelming. While many modern apps are bogged down by complex transactions and authentication, I believe there is beauty in a simpler approach.
As I’ve learned through both farming and coding: the key to a successful project is patience, the same key to a simpler life.
18
33
1.8K
Gardens of the World: Full-Stack Web App
I've always enjoyed gardens, and gardening too. There's this quote by Audrey Hepburn that says: “To plant a garden is to believe in tomorrow.". And, honestly, her 90s series has been such a great inspiration for this project.
This Web App consists of four sections: Home, Gardens, Tips, and Seasons. I've included 9 popular gardens, from the UK to Mexico. If you click on a garden, you'll get a pop-up with some interesting facts about it.
I'll leave you this video of the Seasons section. By pressing the button corresponding to a season, the background of the section changes color, along with the information.
You can read the details here (https://contra.com/p/MFYcqO6q-gardens-of-the-world-full-stack-web-app?referralExperimentNid=DEFAULT_REFERRAL_PROGRAM&referrerUsername=ciro_8_390dd5gp).
9
9
413
The Library of Babel (Full-Stack Inventory App)
Inspired by Jorge Luis Borges’ vision of infinite knowledge, I built a full-stack inventory management app that simulates a digital library system.
The backend, powered by FastAPI, handles CRUD operations and persistent data storage in a flat JSON file.
The frontend, built with Next.js, TypeScript, and Tailwind CSS offers a parchment-themed interface with real-time counters for unique titles and total volumes.
Key features include:
- Smart stacking: Adding a book with an existing ISBN increases its quantity.
- Gradual vanishing: Titles disappear only when all volumes are removed.
- Global search: Filter by title, author, year, or ISBN.
- Archival UI: Designed to evoke the feel of Borges’ hexagonal galleries.
2
34
1.8K
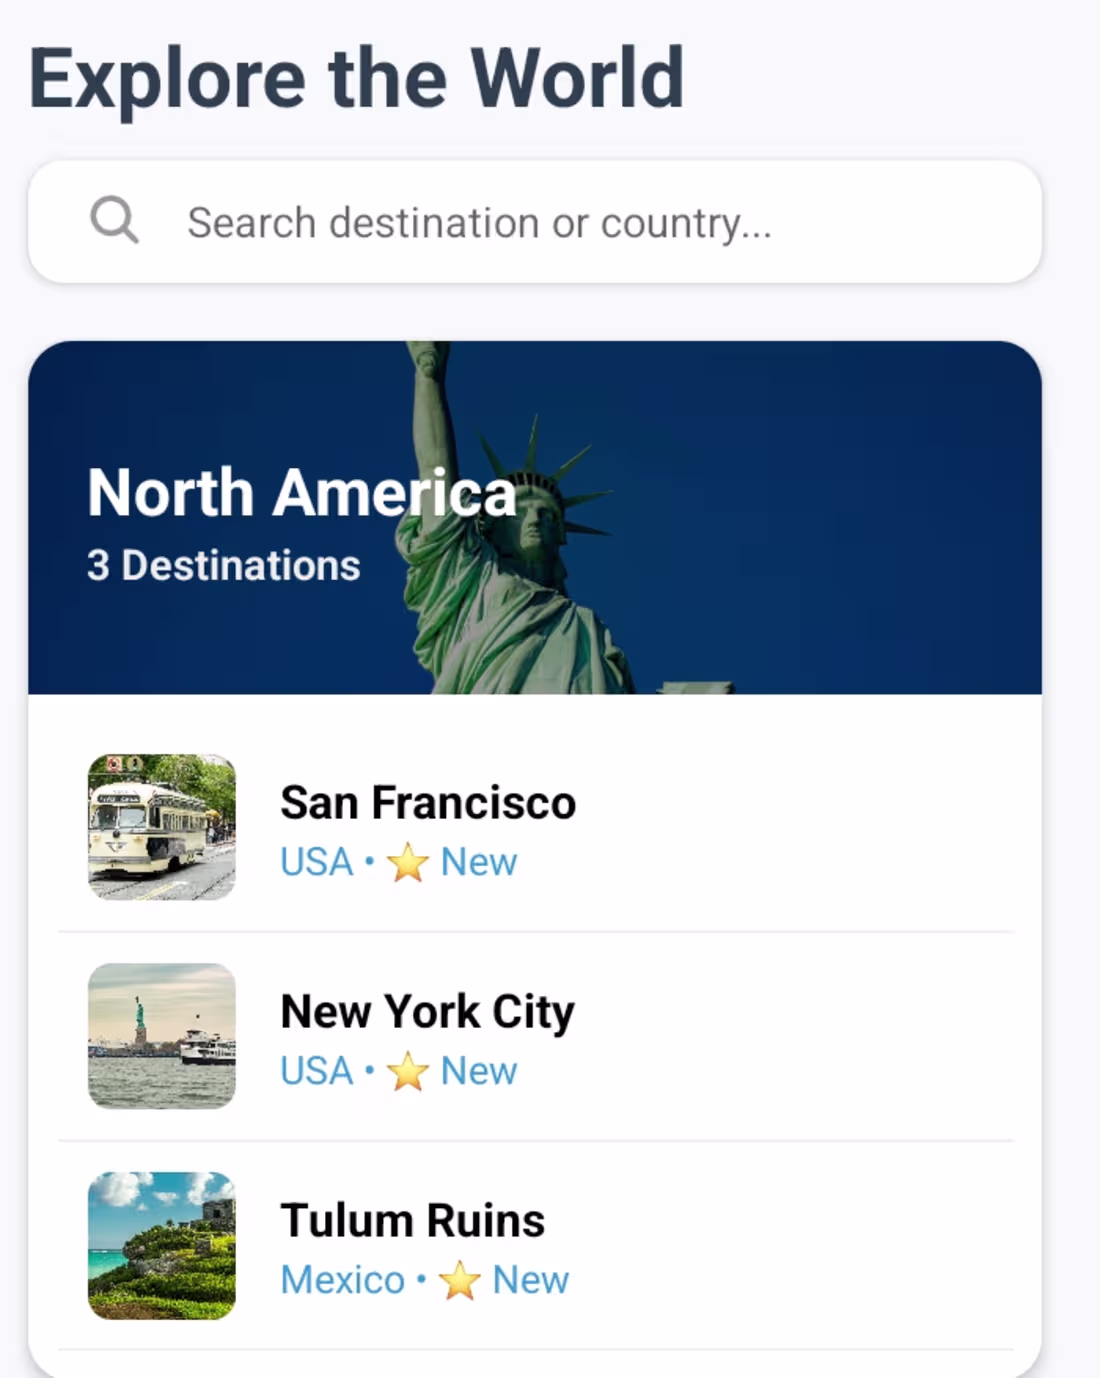
Momentum Travel: A full-stack mobile application for travel discovery and community reviews.
Built with React Native and Supabase for real-time data, featuring a custom Framer-hosted authentication flow. Successfully deployed as a standalone Android (.apk) for a native experience.
Check it out (https://contra.com/p/qrsomWXU-momentum-travel-app-development)
2
27
1.6K
Renewable Grid Simulator (Web App for Science and Sustainability) ♻️💚
A real-time simulation of a renewable energy grid, this full-stack web app models the balance between solar, wind, and hydro production against grid consumption. Users adjust input parameters (sunlight hours, wind speed, water flow, and demand) and the system calculates net energy output using physics-based formulas.
I chose to focus on renewable ‘green’ energies (solar, wind, and hydro) because they represent the most accessible and impactful pathways toward a sustainable future.
Perfect for a science class or as an interactive resource to prepare for Earth Day🪴 (April 22), this project blends technical precision with visual storytelling to make sustainability data engaging and intuitive.
5
21
837
Autonomous Web Intelligence & SQL Reporting Pipeline
Automation doesn’t have to be hidden in the background, it can be interactive and accessible.
I built a professional‑grade Selenium automation system for Microsoft Edge that combines speed with a human‑in‑the‑loop workflow. The engine navigates and captures data, while you stay in control of the search before generating a clean, stakeholder‑ready report.
This project shows how automation can be both powerful and approachable, turning complex web tasks into polished business outputs.
1
31
1.5K
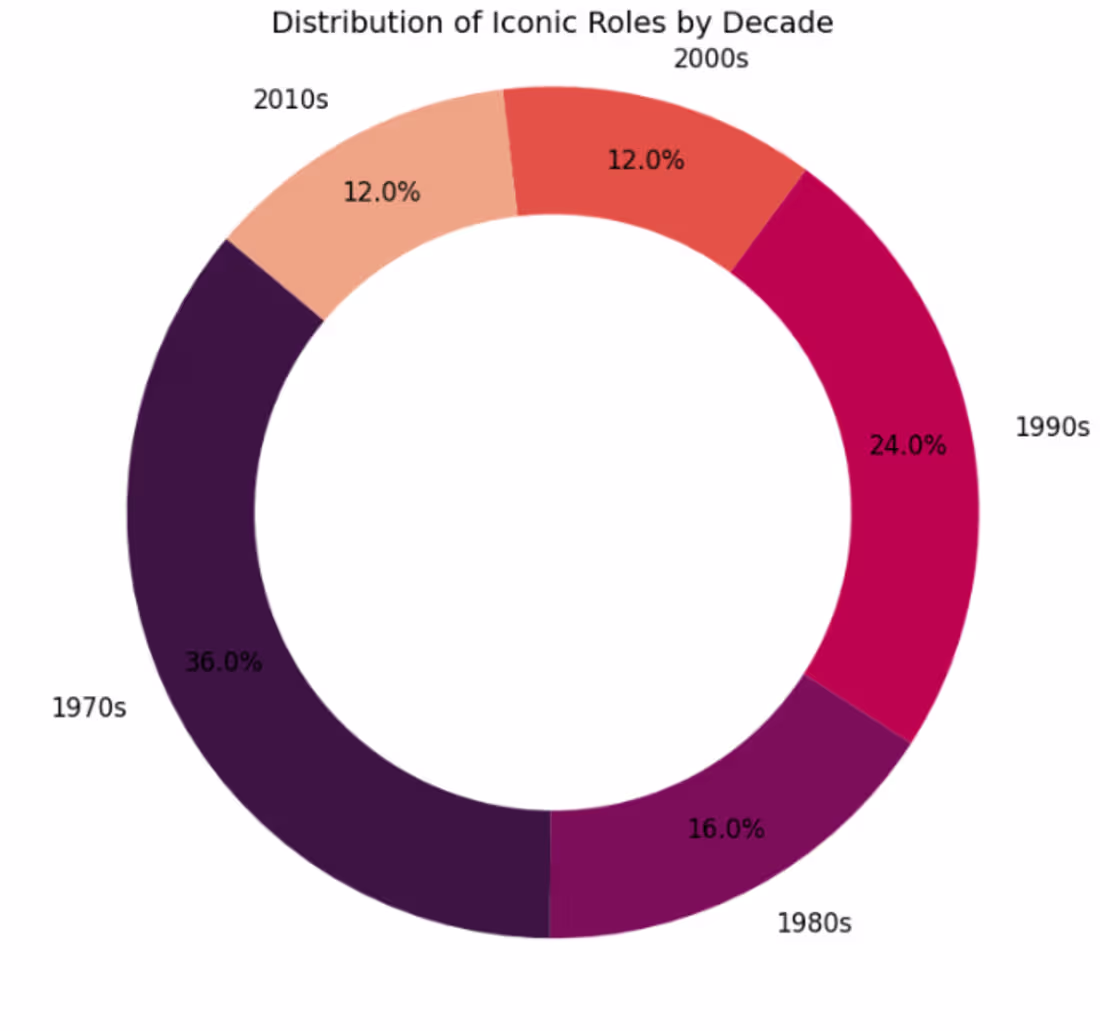
Celebrating Cinema Through Data: Diane Keaton at 80
Some projects go beyond numbers.
To honor the 80th birthday of legendary actress Diane Keaton, I built a Python Notebook on Kaggle featuring a curated selection of 25 of her most iconic films. From Annie Hall to Something’s Gotta Give, the dataset highlights her impact across decades of cinema.
This project is both a technical showcase and a cultural tribute, proof that data analysis can capture not only trends, but also the legacy of an artist.
Read the full article here: Diane Keaton: 80th Birthday Tribute (https://medium.com/@ciroduro01/diane-keaton-80th-birthday-tribute-c2abaffb64d2)
2
36
1.6K
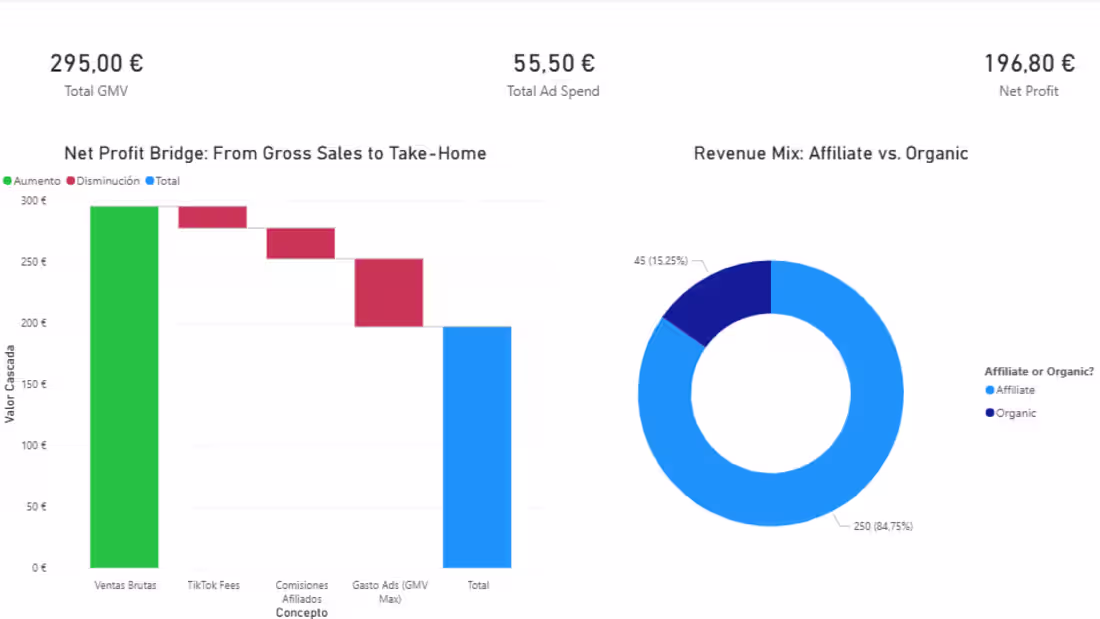
E-commerce brands often struggle to track true profitability across platforms. So, I built a full-stack solution that integrates TikTok Shop operations with Shopify logistics, automating financial reconciliation and delivering executive-level insights.
This project is designed to be modular, secure, and client-friendly, with a clear path from raw data to strategic insight.
GitHub repo here (https://github.com/ciroduro01/Shopify_Project)
2
35
2K
Heritage Soil Station Website Development
11
18
For this week’s #contraquest, I want to share the project that means the most to me.
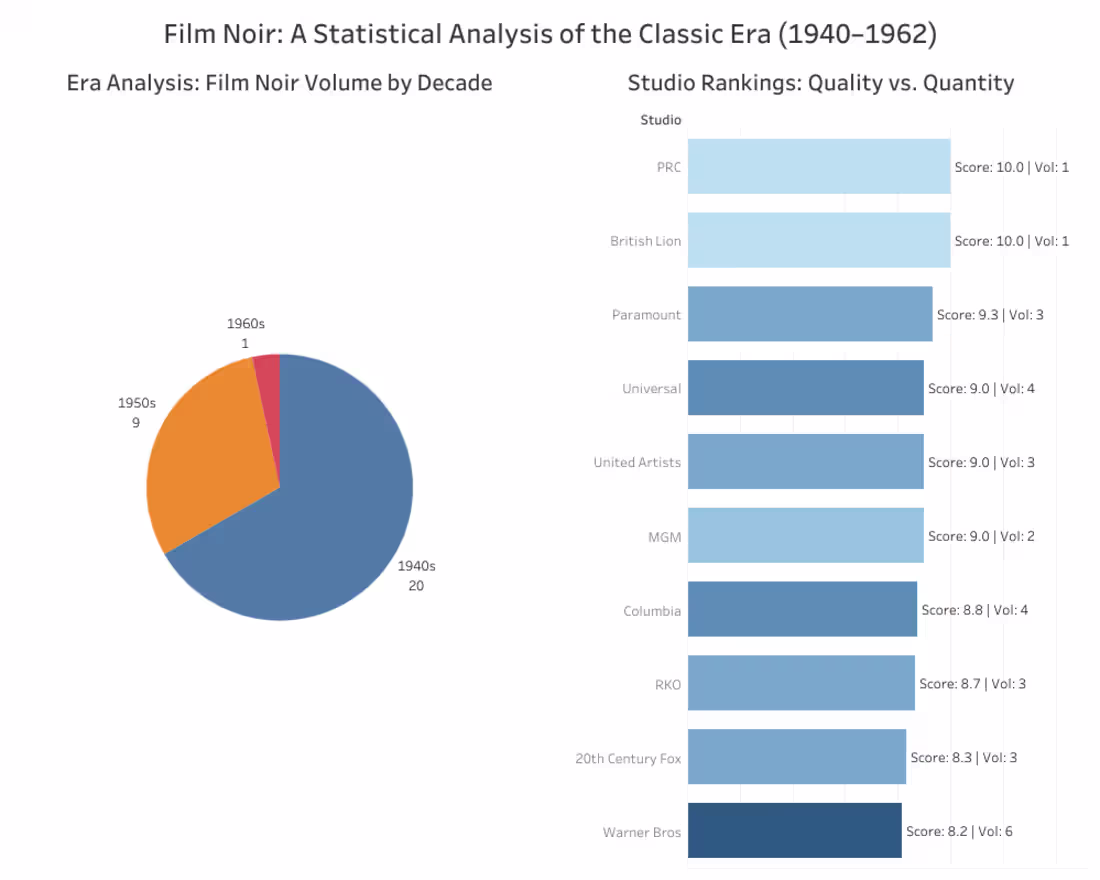
A Data Analysis of the Film Noir Era (1940–1962)
On the surface, it’s a data pipeline: raw Excel, Python ETL, Tableau dashboard... The minor reason it’s special is that I stepped outside my comfort zone and used Tableau instead of my usual Power BI.
But the major reason is personal. This topic, American Film Noir, takes me back to my last year of high school, when I wrote a monograph on the genre’s Golden Age. Revisiting it now, through the lens of data analysis, felt like reconnecting with a piece of my past.
Check it out on my GitHub repo (https://github.com/ciroduro01/Film_Noir_Movies/tree/main), or read the Medium article (https://medium.com/@ciroduro01/shadows-cinema-a-data-analysis-of-the-film-noir-era-1940-1962-b2dd80cde76c).
6
37
1.9K
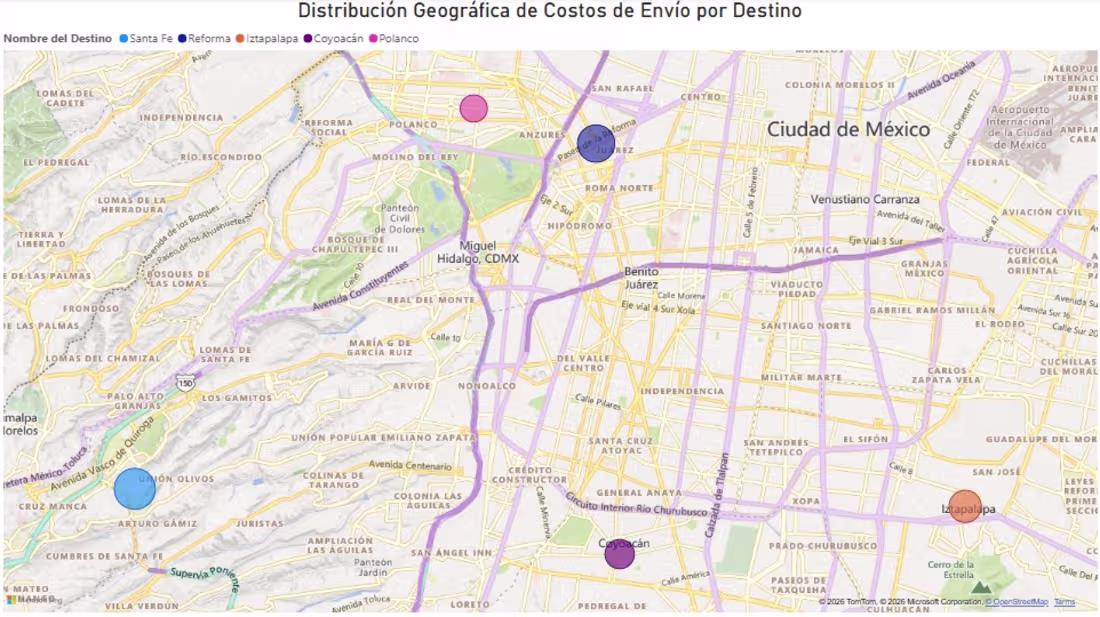
Last-Mile Logistics in Mexico City
Mexico City is more than a metropolis — it’s a living system of movement, culture, and connection.
This project is my tribute to its complexity: a full-stack logistics model that maps package flow from a central hub to key destinations across CDMX.
This isn’t just about logistics — it’s about designing systems that reflect the pulse of a city I deeply admire.
Read the full breakdown: Logistics in Mexico City (https://medium.com/@ciroduro01/database-modeling-last-mile-logistics-in-mexico-city-1b6d5a428ea6)
To everyone who’s supported my previous posts — thank you. Your feedback, likes, and curiosity keep me building, sharing, and refining. This one’s for you❤️
32
1.5K
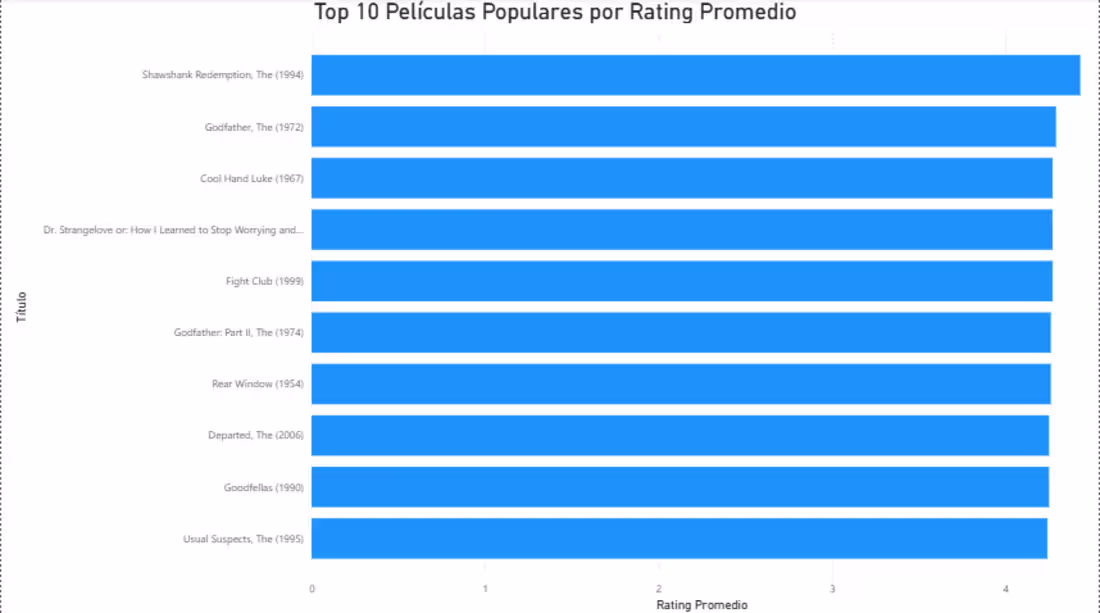
Ever wondered what your favorite movies look like through the lens of data?
In this project, I built a complete ETL pipeline to clean and structure the MovieLens dataset, then applied Python + SQL analysis to uncover trends in ratings, genres, and viewer behavior.
2
27
1.3K

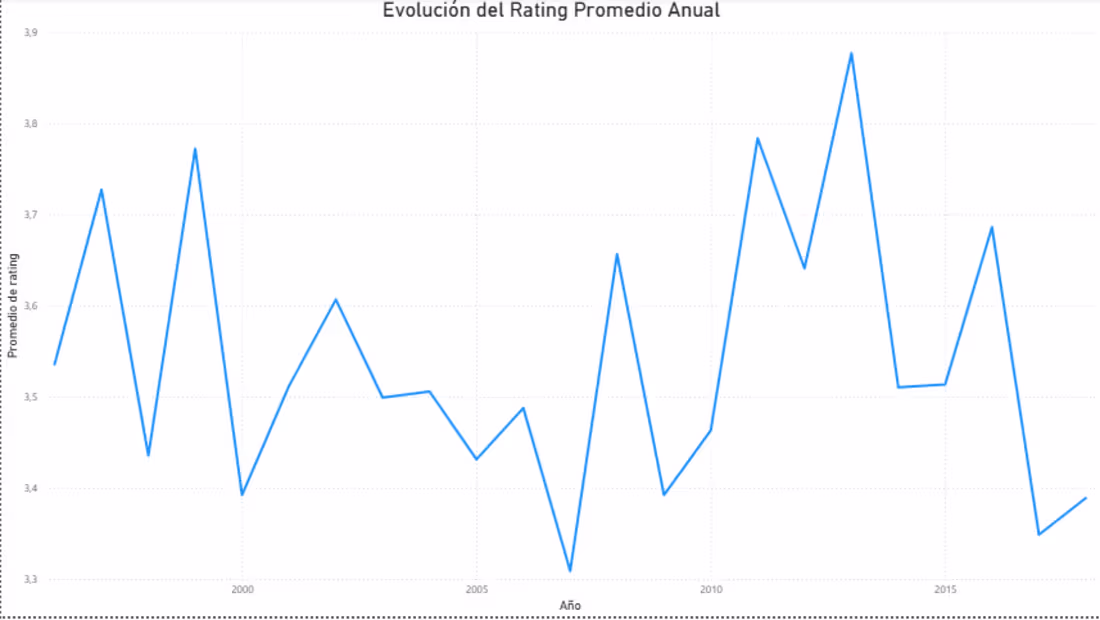
Movies don’t just tell stories — they leave behind data trails.
In this project, I applied time series techniques to the MovieLens dataset, uncovering how ratings evolve across years and genres, and what those shifts say about audience preferences.
This project shows how data can capture the pulse of cinema — from the rise of certain genres to the subtle decline of others.
3
25
1.1K
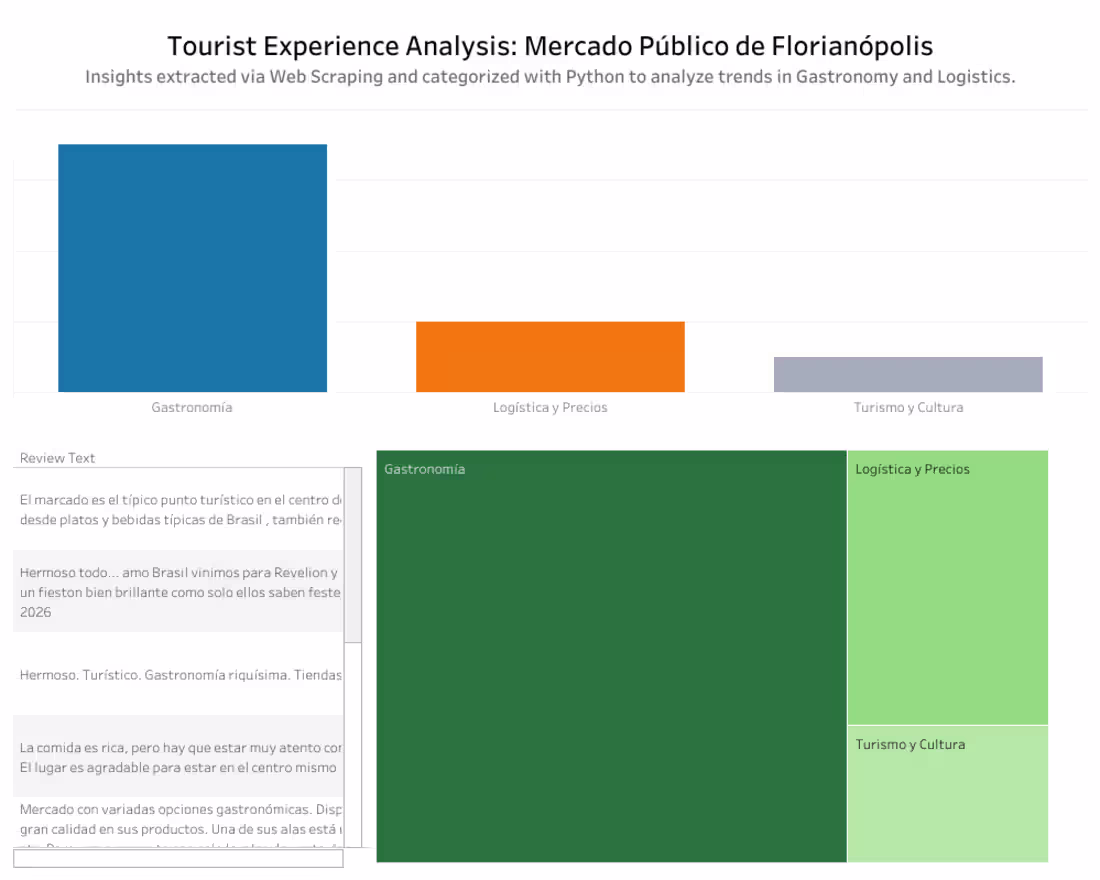
It’s summer in the Southern Hemisphere, and families in this area are heading to the beach. One of the most amazing places to visit is Florianópolis, known for its vibrant culture and seaside charm.
To understand what makes the city’s Mercado Público so special, I built an end‑to‑end data pipeline: scraping Google Maps reviews with Python and Selenium, storing them in PostgreSQL, and categorizing them with Pandas. The insights are visualized in an interactive Tableau dashboard. It's also the first time I used another tool: Beekeeper!
This project blends data engineering, sentiment analysis, and business intelligence to highlight how people experience one of Brazil’s most beloved destinations.
You can explore my GitHub repo (https://github.com/ciroduro01/floripa_tourism_analysis) for more information.
Have a nice week! ♥️
2
17
844
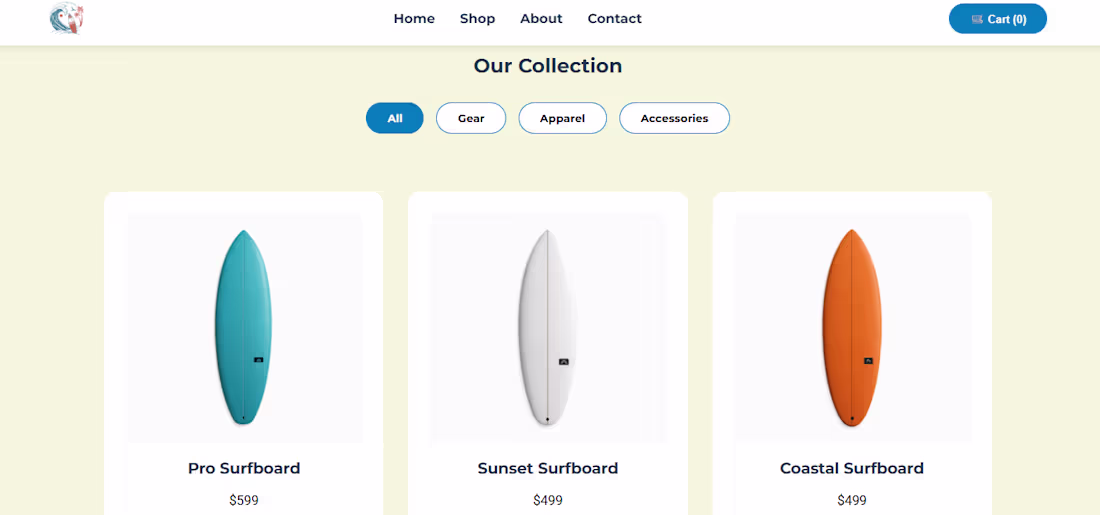
This is the project I'm working on right now... It's a website for a Surfing Store in Malibu, called SurfWave. This is still a pre-version, sort of like a draft, but I just wanted to share this piece of work I'm doing. Hope I can finish it this week. Happy Tuesday!
6
22
1.5K
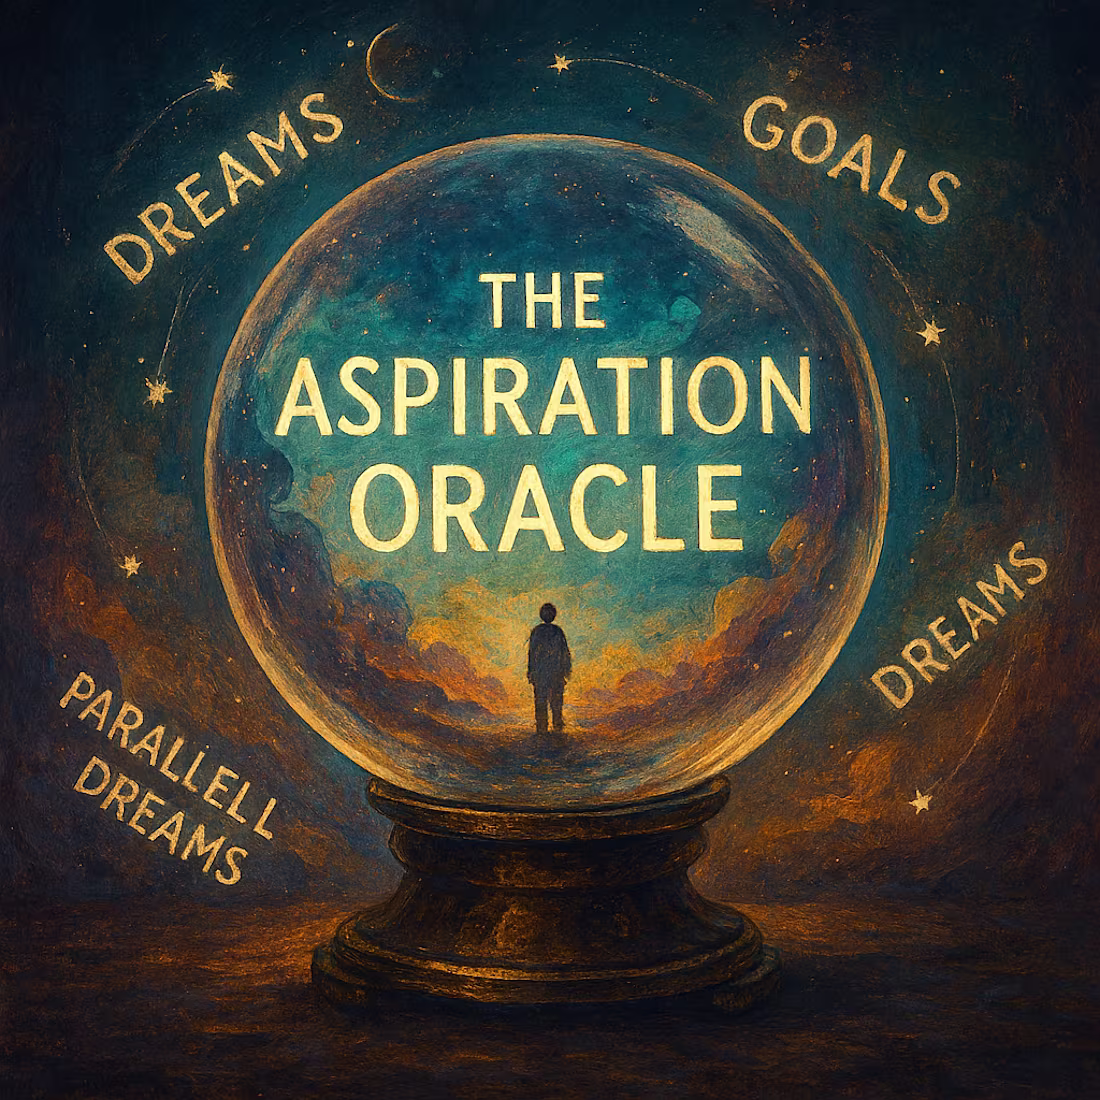
"And have you any dreams you'd like to sell? Dreams of loneliness." — Stevie Nicks
This line has always resonated with me. It inspired my latest project, where I explore the transition from Descriptive Analytics to Predictive Analytics. Not just as a technical shift, but as a metaphor for how we approach our own aspirations.
In this piece, I dive into the world of parallel dreams: the paths we imagine, the futures we forecast, and the ways data can mirror the uncertainty and beauty of human ambition.
It’s my most personal project to date, because beyond the analytics, it reflects my own dream: to finally find a job where my skills, philosophy, and way of working can thrive.
Read the full article here (https://medium.com/@ciroduro01/the-aspiration-oracle-predictive-life-strategy-513b12e84fd3)
Don't stop dreaming ♥️
19
1K
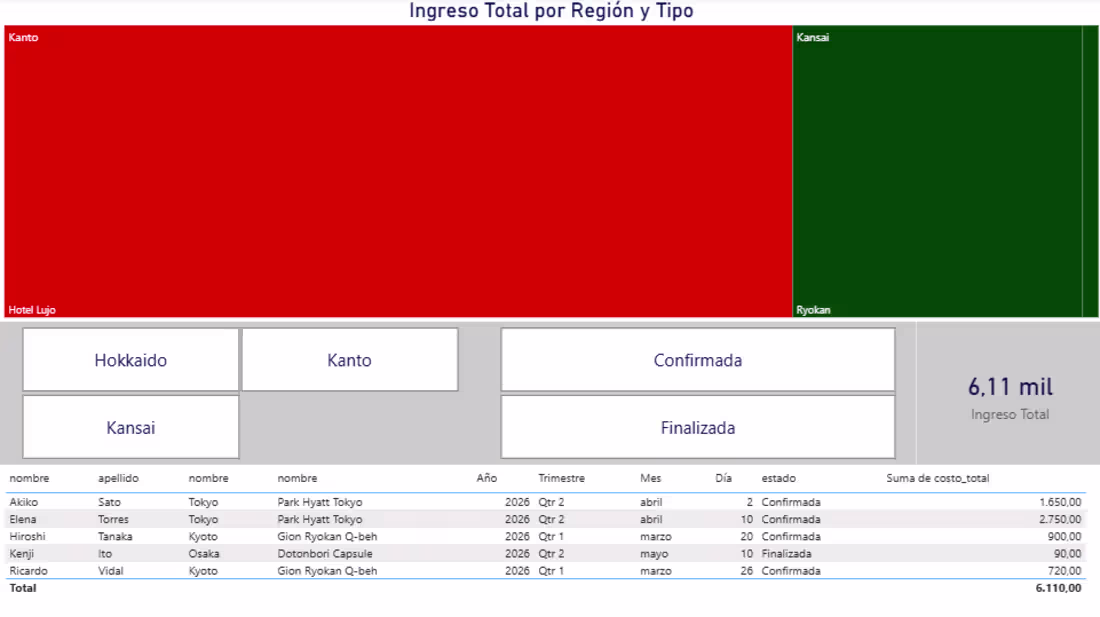
BI Meets Japan: A Dashboard That Tells a Story
Tokyo’s luxury hotels. Kyoto’s quiet ryokans. Osaka’s capsule pods. I built a Business Intelligence dashboard that doesn’t just track bookings, it maps the heart of Japanese tourism.
This project dives into regional income flows using PostgreSQL, DBeaver, and Power BI. The result? A dynamic dashboard where Kanto dominates, Kansai charms, and Hokkaido waits for its moment.
It’s not just data, it’s storytelling through filters, KPIs, and treemaps.
If you love travel, analytics, or Japan’s layered beauty, this one’s for you.
Read the full breakdown here: Japan Travel Agency (BI) (https://medium.com/@ciroduro01/business-intelligence-japan-travel-agency-9c2618cae6d1)
18
952
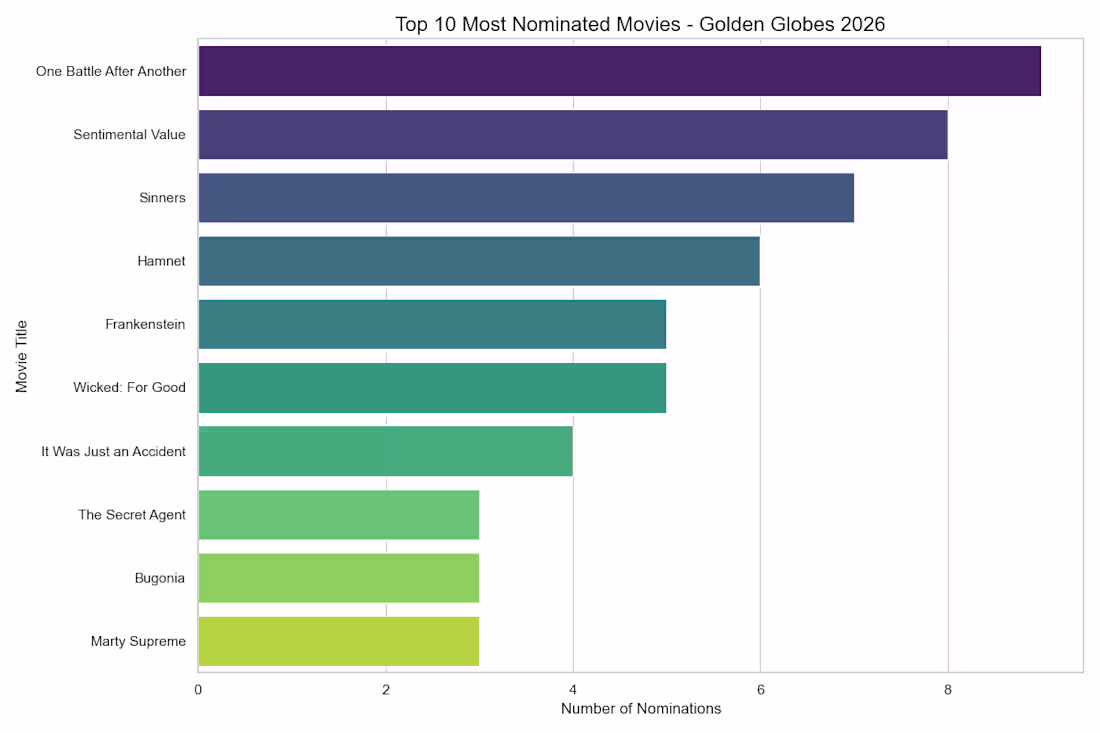
Award season meets analytics — and it all comes to a head this Sunday, January 11, when the Golden Globes 2026 ceremony takes place in Los Angeles.
To celebrate, I built a full-stack data project exploring the 2026 Golden Globes movie nominations, starting with a custom CSV dataset featuring:
🎬 Movie, Director, Genre, Nominations
🍅 Tomatometer, 🍿 Popcornmeter, Metascore Approval & User Score
From there, I created:
📊 Python visualizations with Matplotlib & Seaborn
🍩 Power BI Donut Charts showing genre distribution and metascore approval
This project combines technical depth with cultural relevance, showing how data can illuminate trends in film recognition and audience reception.
Read my Article on Medium ➡️ Article (https://medium.com/@ciroduro01/golden-globes-2026-a-data-driven-look-at-the-movie-nominations-8df7a40e84b1)
2
18
978

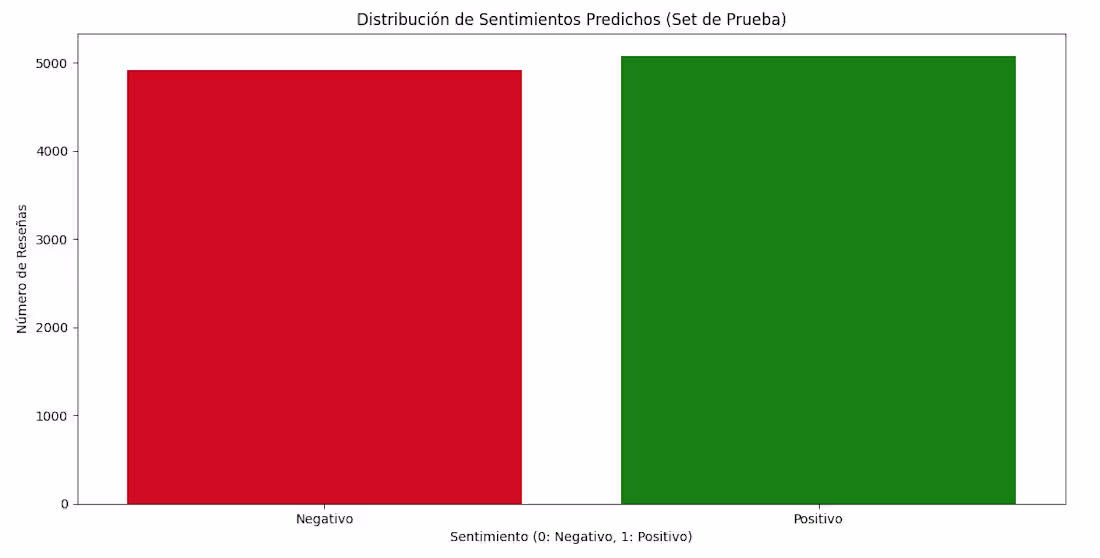
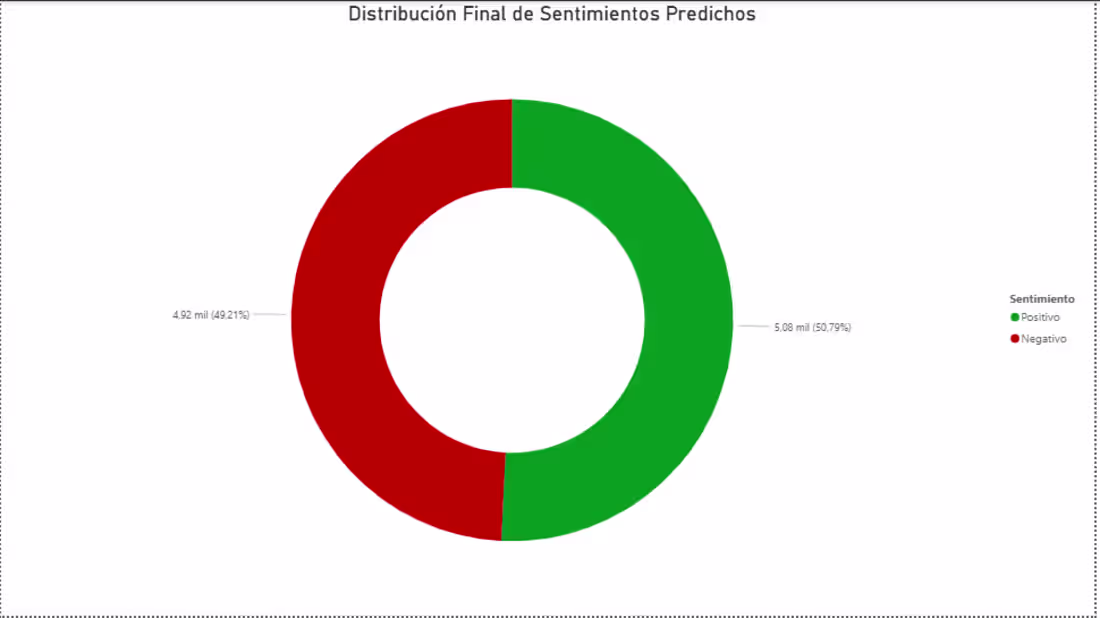
Behind every star rating is a story — and behind every review is an emotion.
In this project, I applied Natural Language Processing (NLP) techniques to analyze thousands of movie reviews, uncovering how audiences truly feel about the films they watch.
This project shows how data can capture not just numbers, but the emotional pulse of cinema.
2
20
955
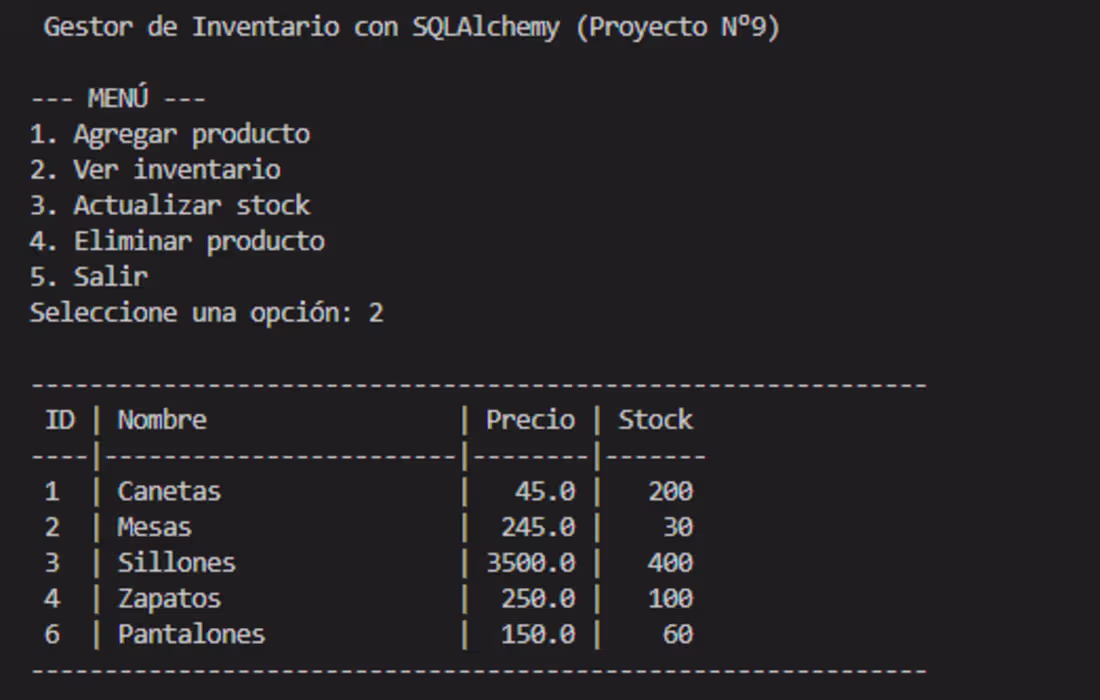
Inventory Management System Development with SQLAlchemy
1
1

Python Task Management System with CRUD Features
3
4

Weather Data Analyzer (REST API Integration)
2
4

Time Series and Trend Analysis for MovieLens
2
1
ETL and Data Analysis of MovieLens Dataset
2
2
Customer Segmentation Analysis for Online Retail
2
8
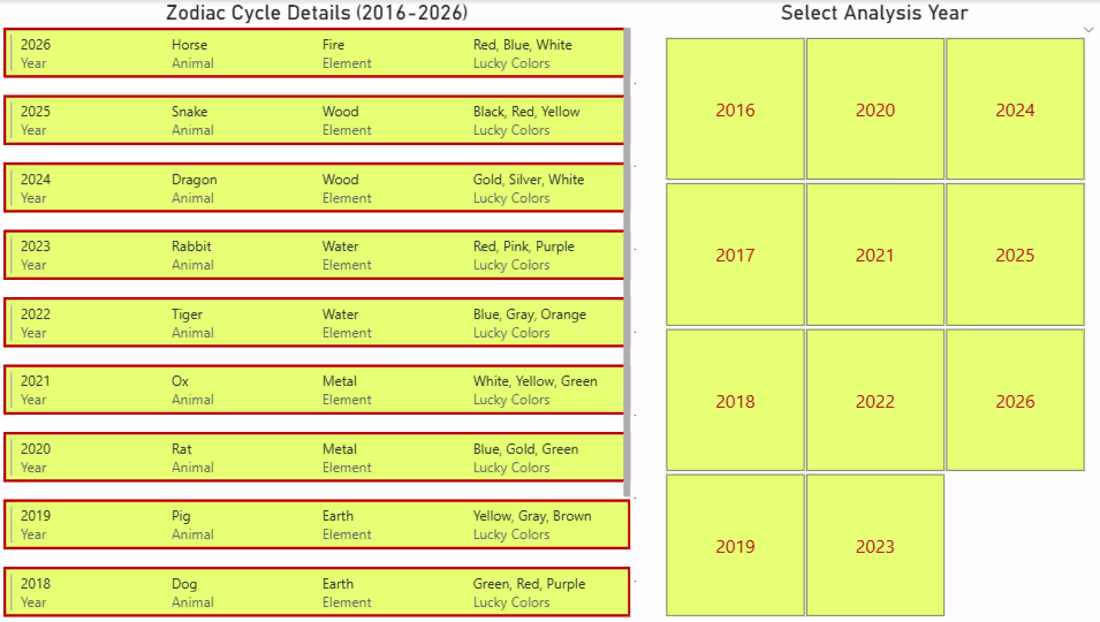
2026 Lunar New Year Data Analysis
1
7
Sentiment Analysis of IMDB Movie Reviews
2
8
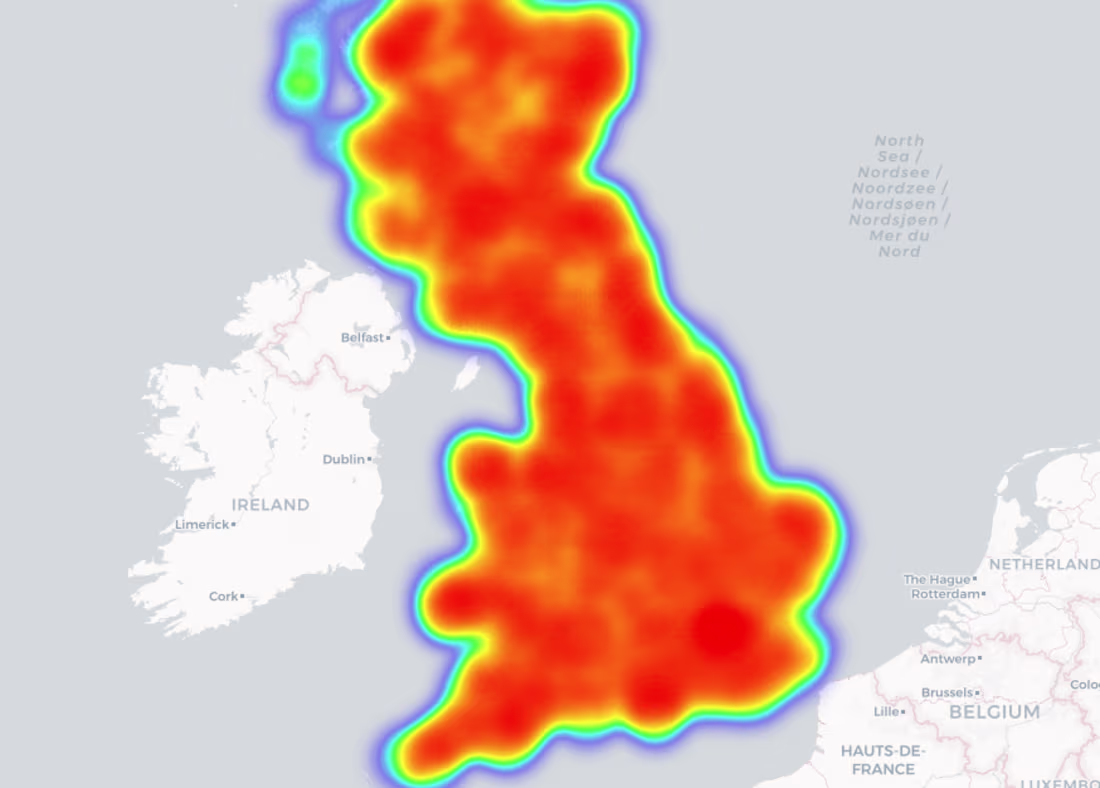
Geospatial Analysis of Traffic Accidents in the United Kingdom
2
2
380

Home Value Prediction with Random Forest Model
2
8

Automation of Email Reports with Python
1
3
Momentum Travel App Development
1
3
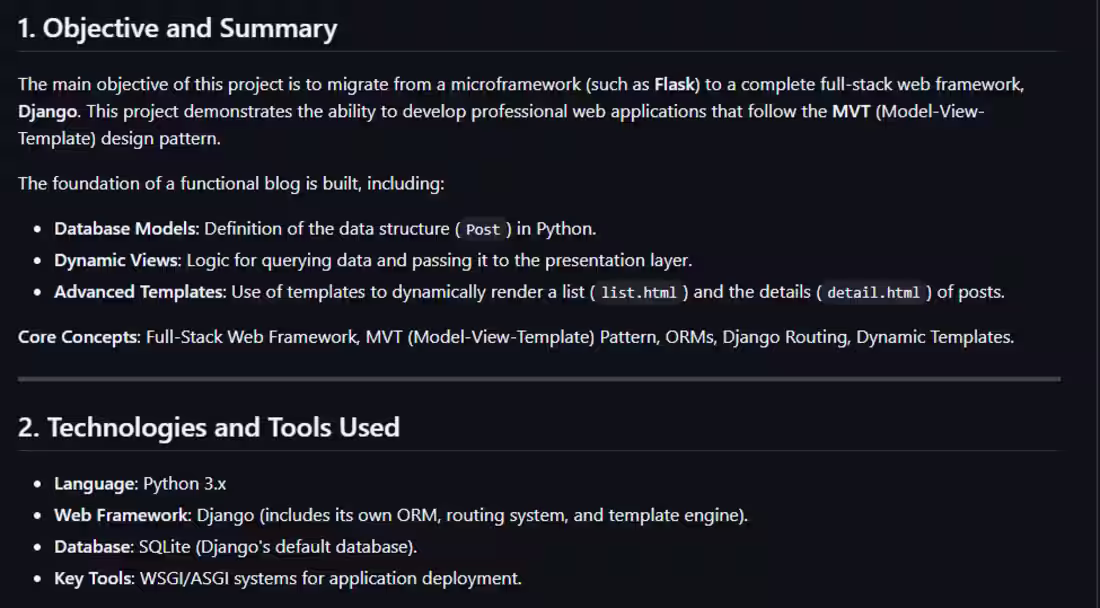
Professional Blog with Django (Developing a Full-Stack Web Application with a Framework)
1
348
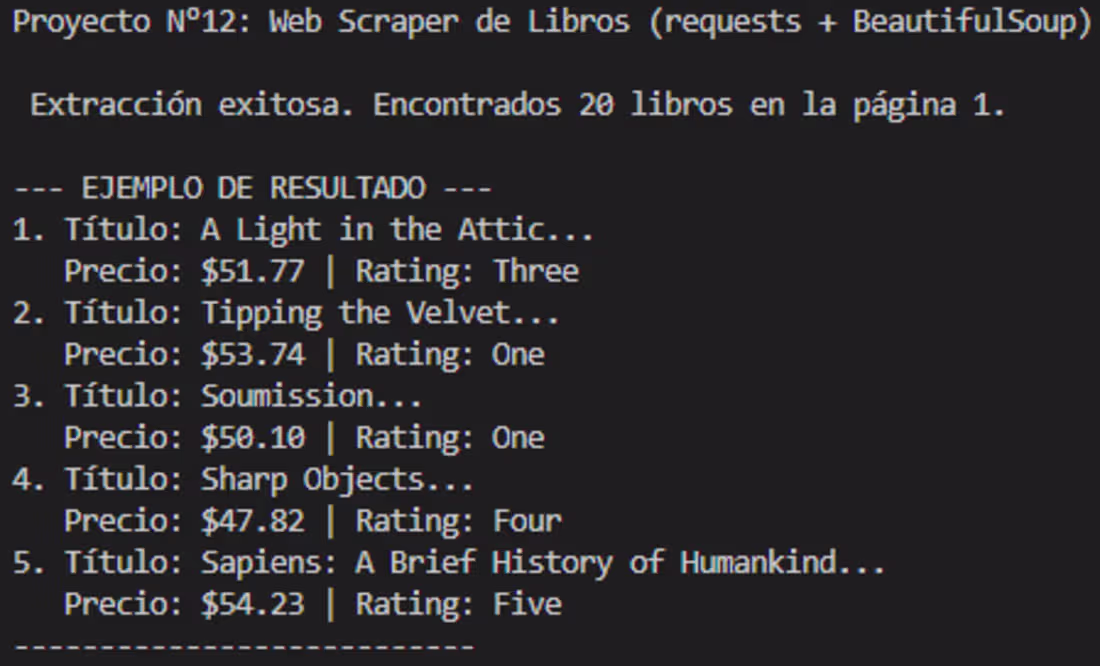
Book Catalog Web Scraper
1
3

Academic Management Database Modeling
1
5
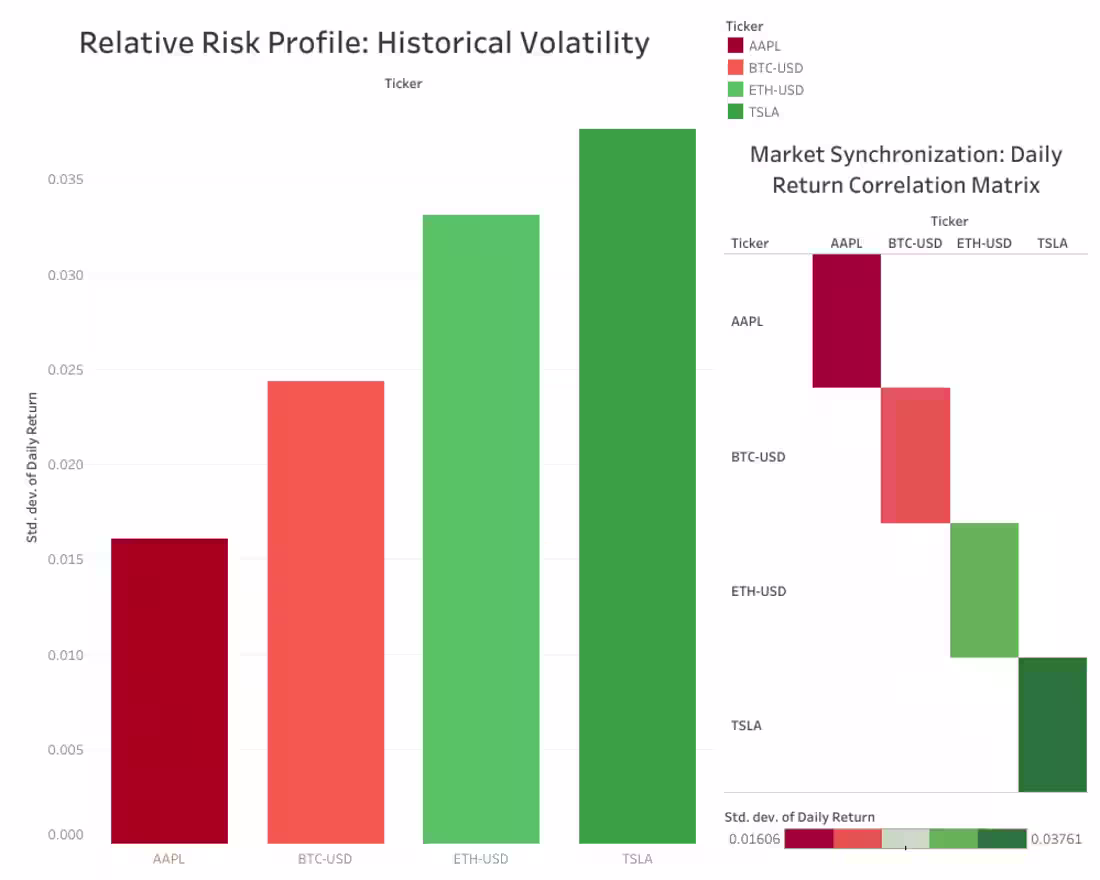
Financial Market Analysis: Stocks & Crypto Volatility
1
7
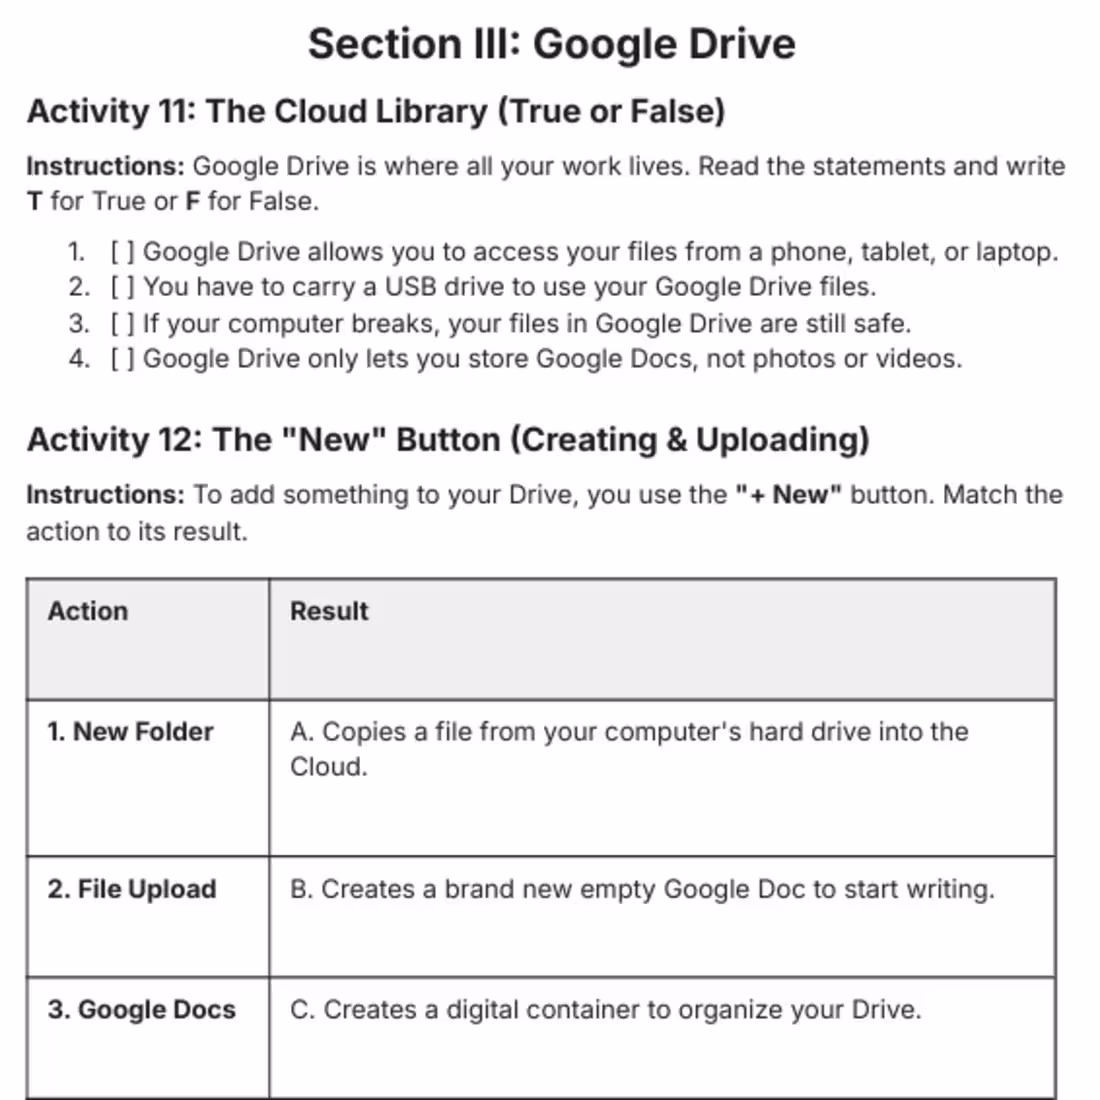
Digital Foundations Series: 120+ practical activities designed to take students from basic computer use to mastery. Open-source educational materials for IT/ICT teachers and students.
1
349
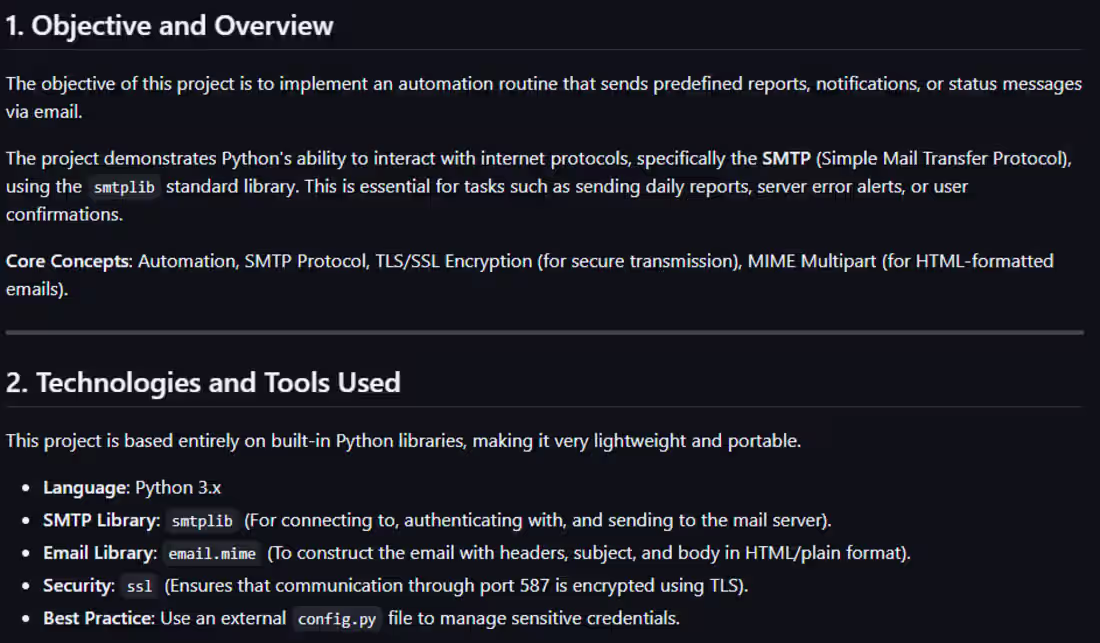
Sending Automatic Reports via Email (Automating Notifications with smtplib)
1
23
487
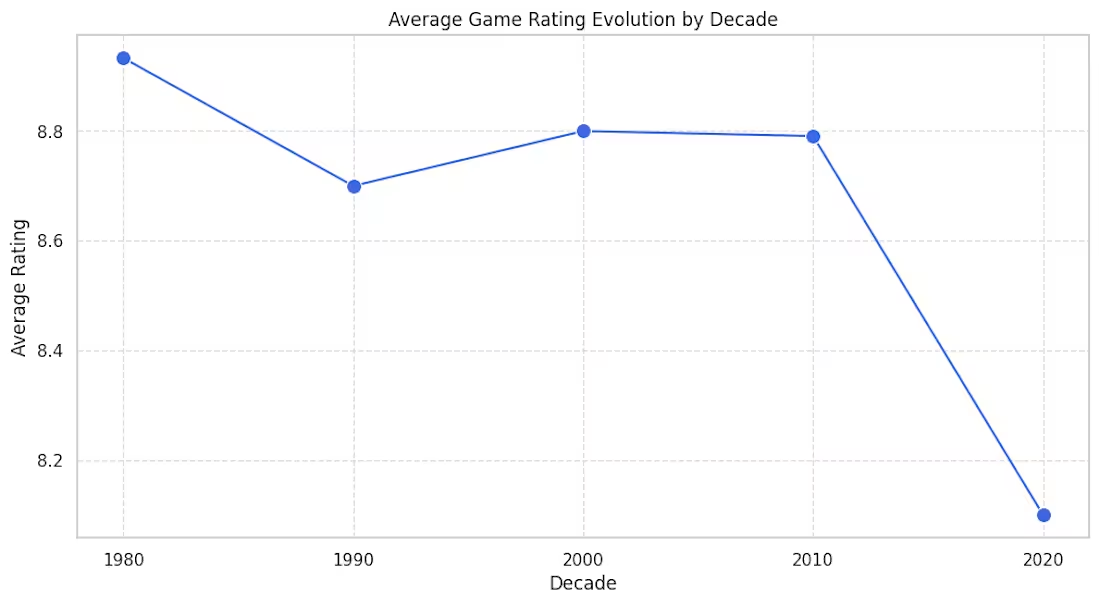
Popular Videogames Analysis: From Flat Data to Relational Insights
1
395
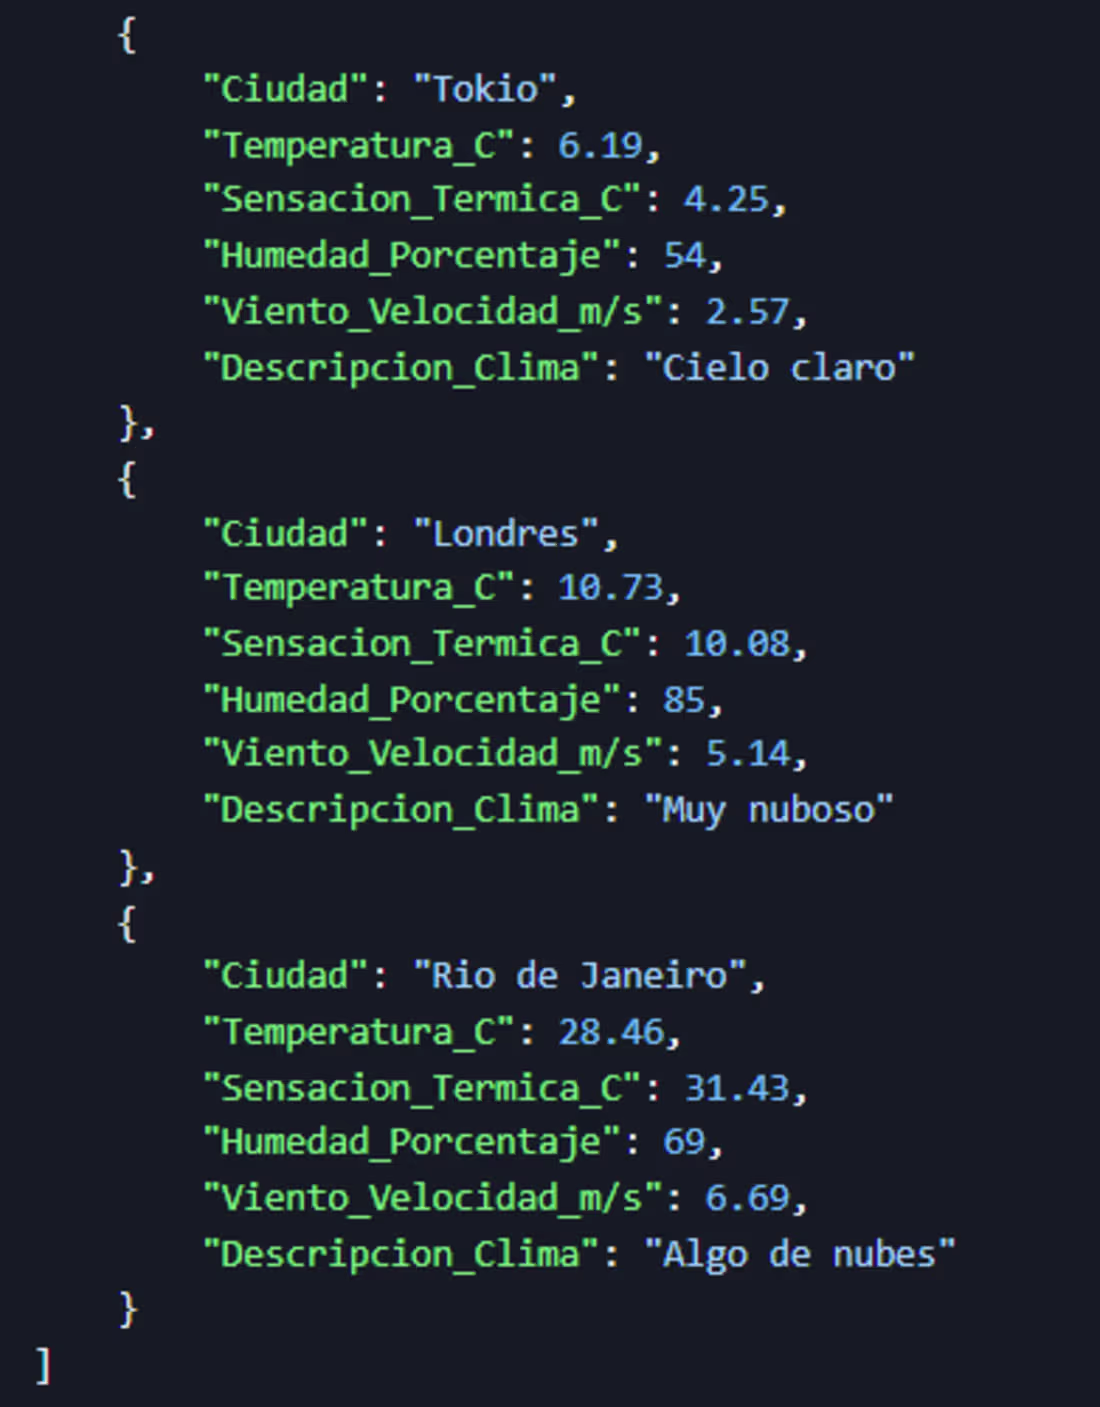
Weather Data Analyzer (REST API Interaction, HTTP Requests, and JSON Processing)
1
377
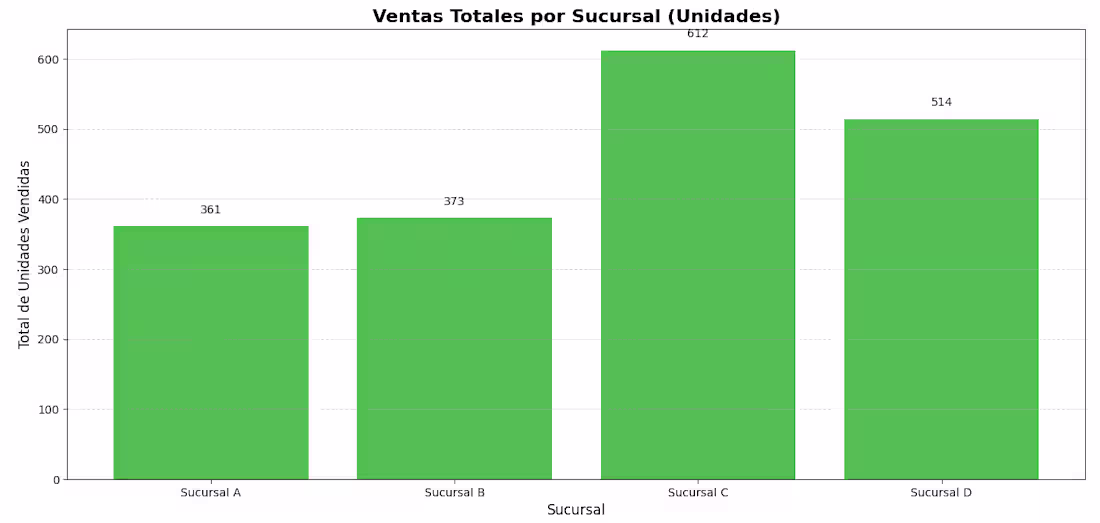
Visual Analysis of Sales Data (Data Visualization with the Matplotlib Library)
1
309

Inventory System with ORM (Database Abstraction with SQLAlchemy (Object-Relational Mapping))
1
293
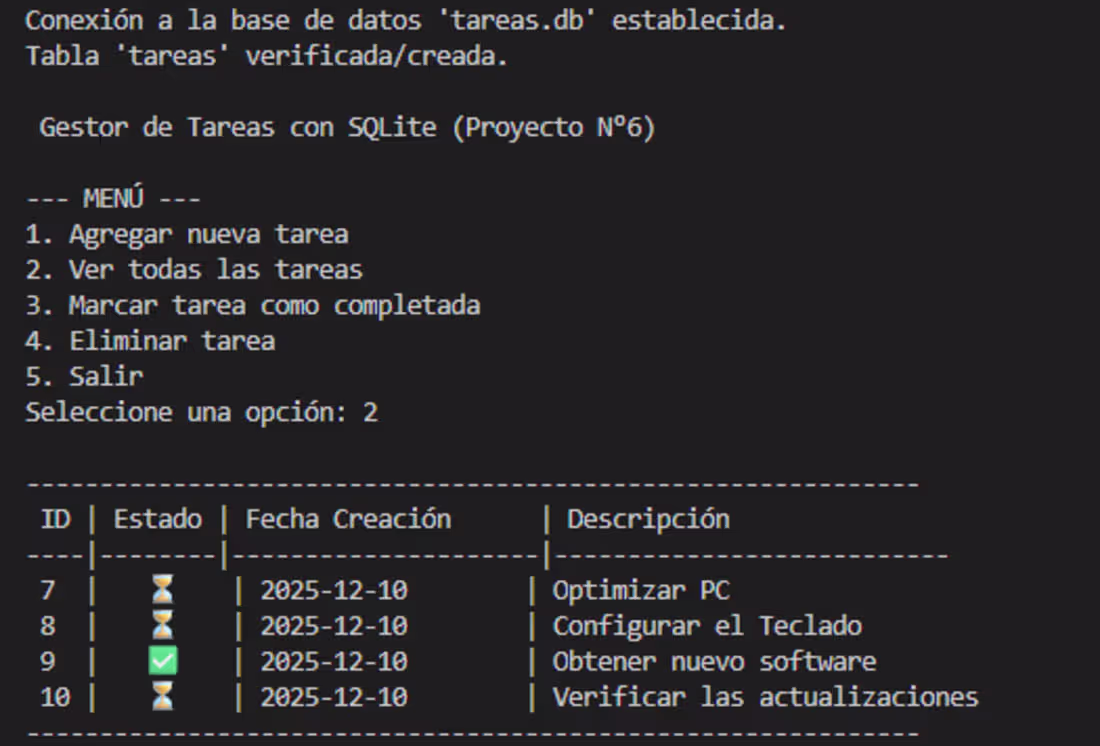
Task Management System (CRUD Application with SQLite Database)
1
343
Sentiment Analysis of Movie Reviews
1
346
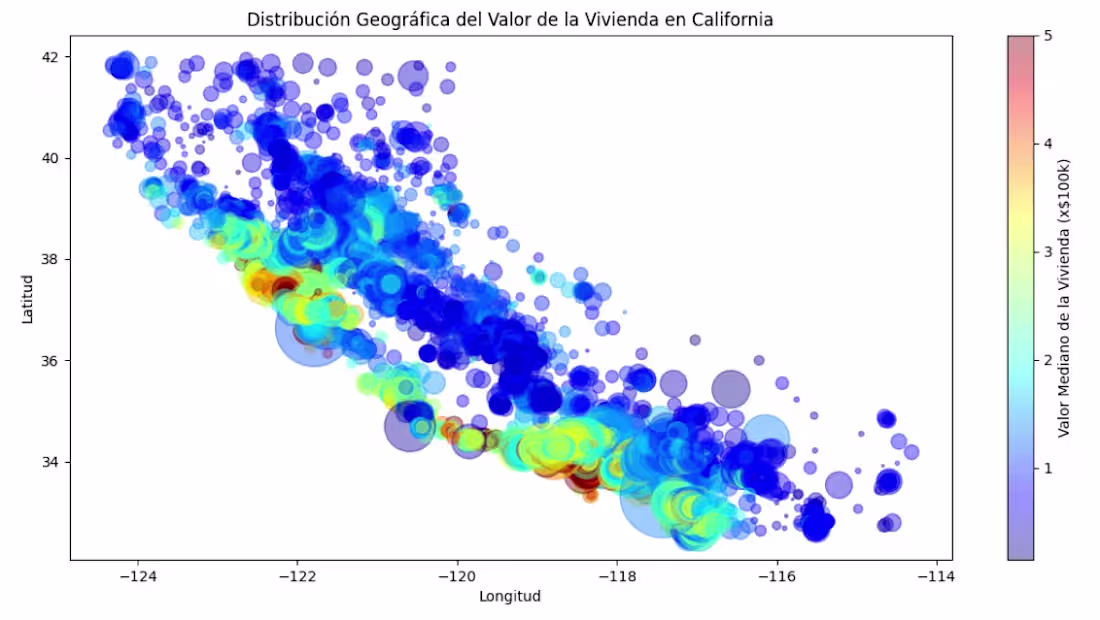
Home Value Prediction (Regression)
3
347

Geospatial Analysis of UK Traffic Accidents
1
3
Time Series and Trend Analysis
1
264

ETL and Data Analysis of Movies
1
2
326
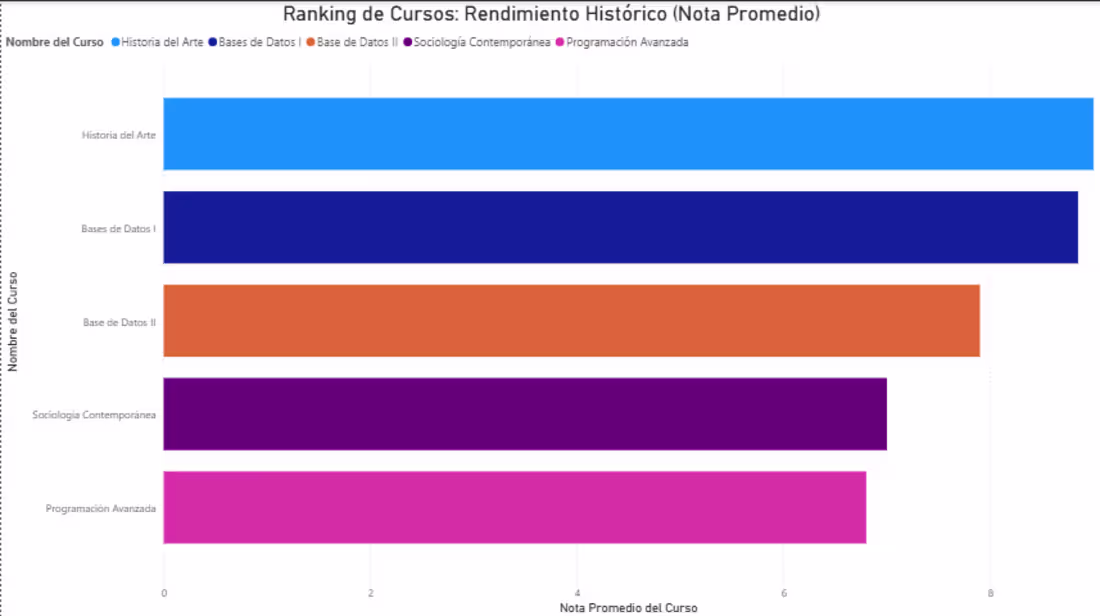
Academic Management — Database Development & SQL Analytics
1
324
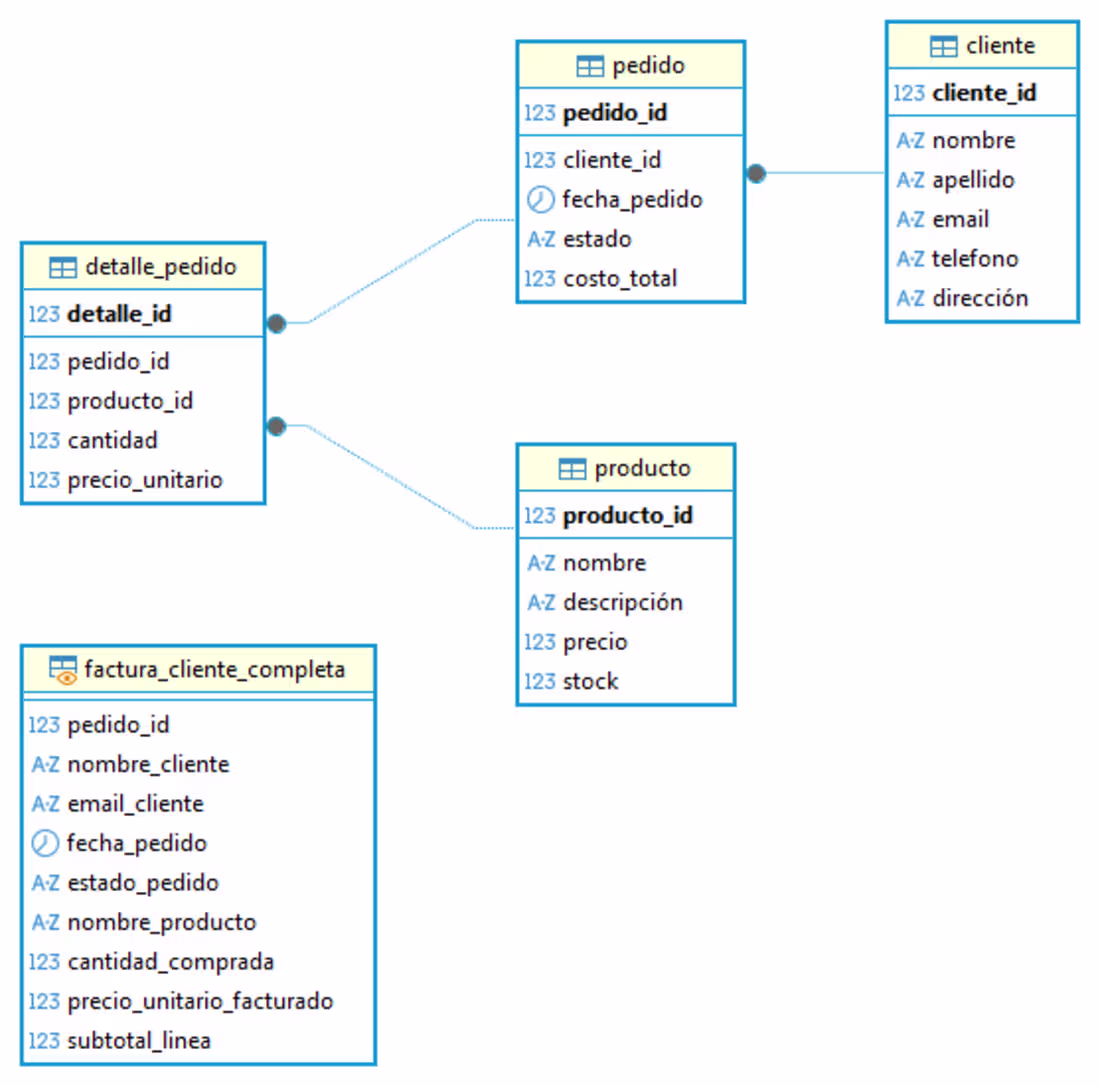
Database Modeling - E-Commerce Platform
1
304

Book Catalog Web Scraper (Web Data Extraction with Python)
1
303

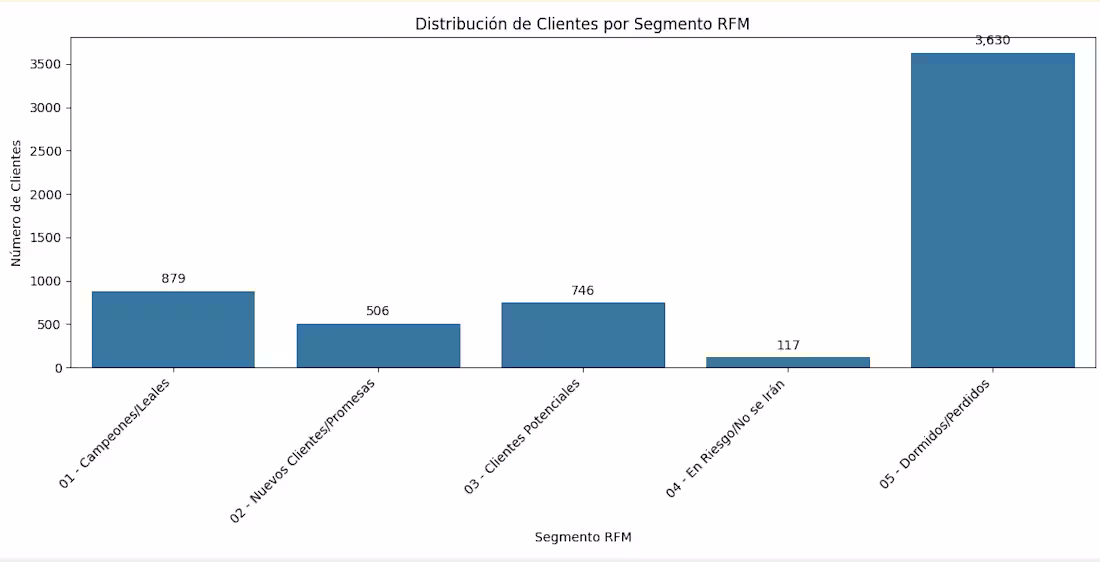
Customer Segmentation Analysis (RFM) — Online Retail
1
289