
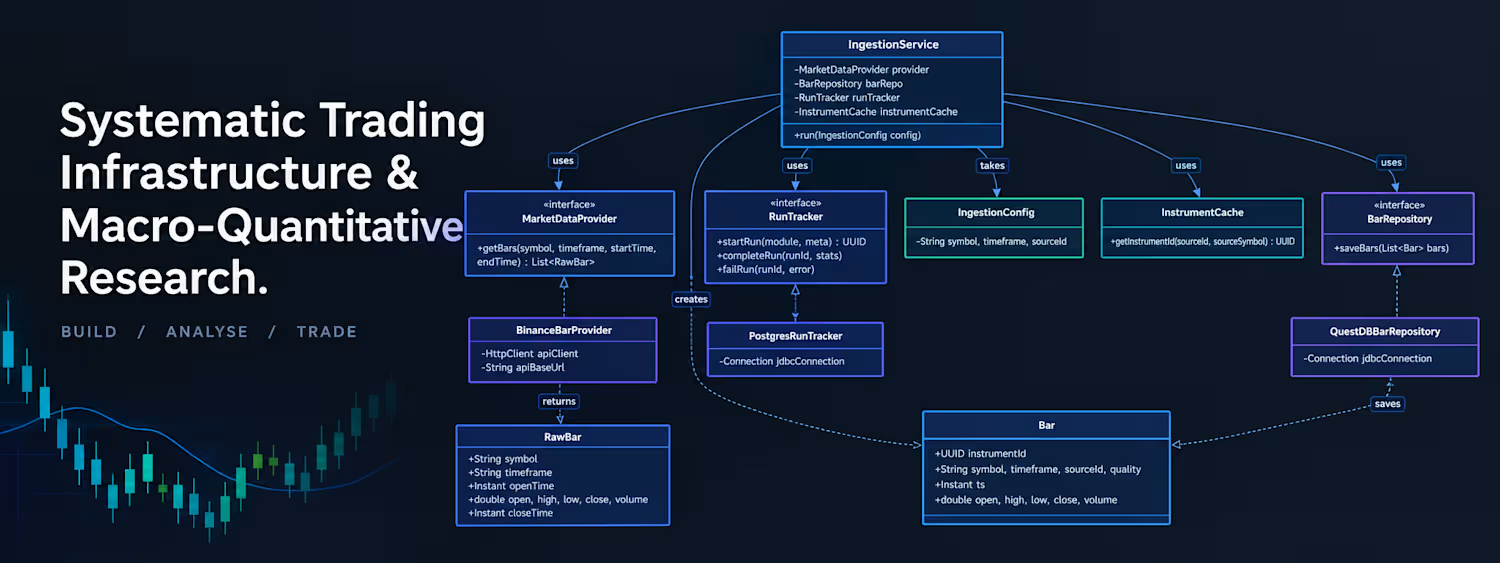
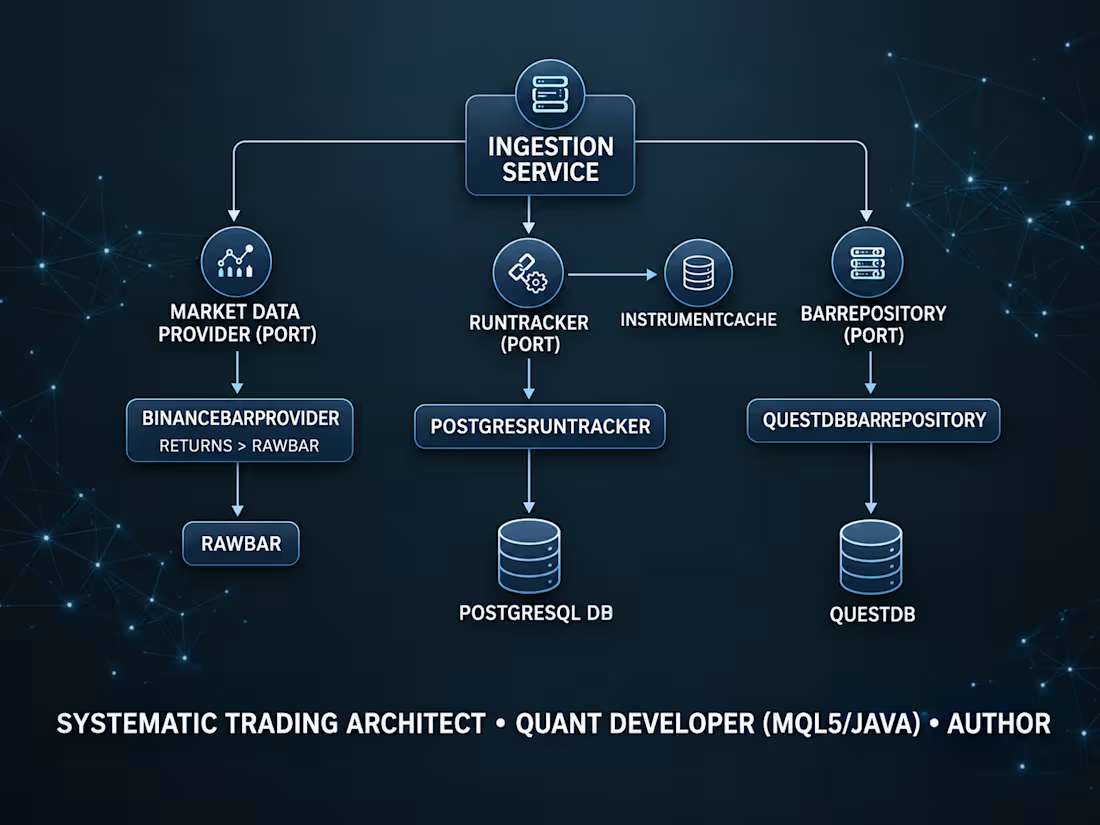
Decoupled Market Data & Analysis Engine (Java / Spring Boot)
Description:
Designed and built a modular algorithmic trading infrastructure demonstrating senior-level backend architecture.
Core Architecture: Utilizes Hexagonal Architecture to completely isolate the core IngestionService and AnalysisService from external dependencies. Implements the Adapter, Repository, Builder, and Dependency Injection patterns.
Data Engineering: Implements a dual-database design. PostgreSQL handles instrument symbology and run-audit logging, while QuestDB manages high-throughput OHLCV time-series data using monthly partitioning and deduplication keys (idempotent upserts).
Pipeline: Autonomously fetches live market data (via REST), parses raw JSON into canonical domain objects, computes statistical indicators (SMA, Z-Score), and stores the analytical results for downstream signal generation.
0
39
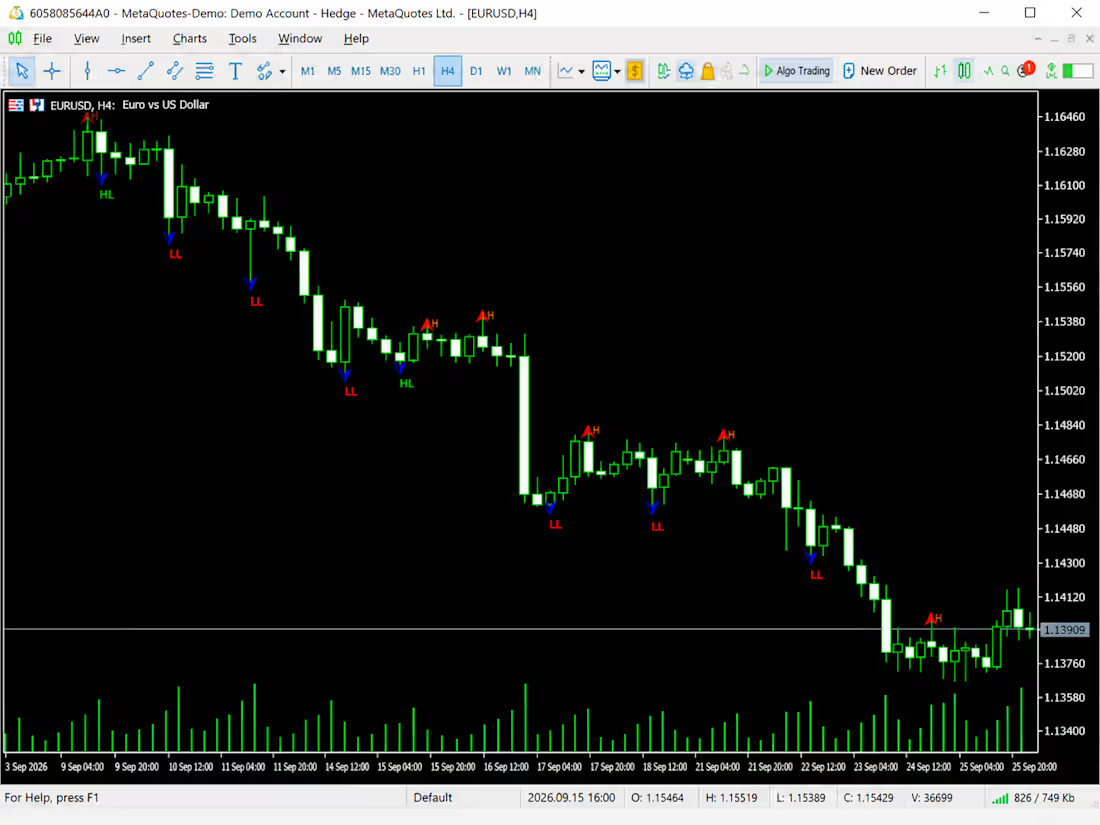
SwingPoints_H4
What it does: Detects swing highs and swing lows on a chart using configurable left/right bar strength, plots them as arrows, and labels each one with its structural classification — HH (higher high), HL (higher low), LH (lower high), or LL (lower low).(This Indicator is designed to be used on the h4 time-frame)
What makes it non-trivial:
Configurable strength. ...
Structural labelling. ...
Object lifecycle management. ...
EA-friendly accessor functions. ...
Buffer-based output. ...
Inputs:
InpLeftBars — ...
InpRightBars — ...
InpMinMovePoints — ...
InpShowLabels — ...
InpMaxBars — ...
Dependencies: None. Standalone indicator.
0
58

The Silver Catch-Up: Leveraging Basel III Catalysts and Algorithmic Mean Reversion
Introduction
Market forecasting is the ability to identify the most probable future price movements based on historical patterns and data analysis. To achieve this, traders and analysts must employ robust tools to analyze market data. To get a complete picture of why a market behaves the way it does, both technical factors and seemingly exogenous macroeconomic influences must be studied together.
What You Will Take Away From This Analysis:
Understand the Macro Catalyst: How central bank reserve diversification (the shift from “return on capital” to “return of capital”) and Basel III regulatory frameworks created a structural floor for gold, setting the stage for silver’s mean-reversion catch-up.
Apply a Rule-Based Framework: How to use rolling percentiles (60th/80th) and real-time Pearson correlation to objectively identify market regime changes and avoid “signal fatigue,” replacing subjective guesswork with statistical thresholds.
Download the Free Analytical Toolkit: Access the complete, modular MQL5 toolkit—including the Master Indicator, Correlation Monitor, and Strategy Tester EA—to apply this exact framework to your own charts.
0
74
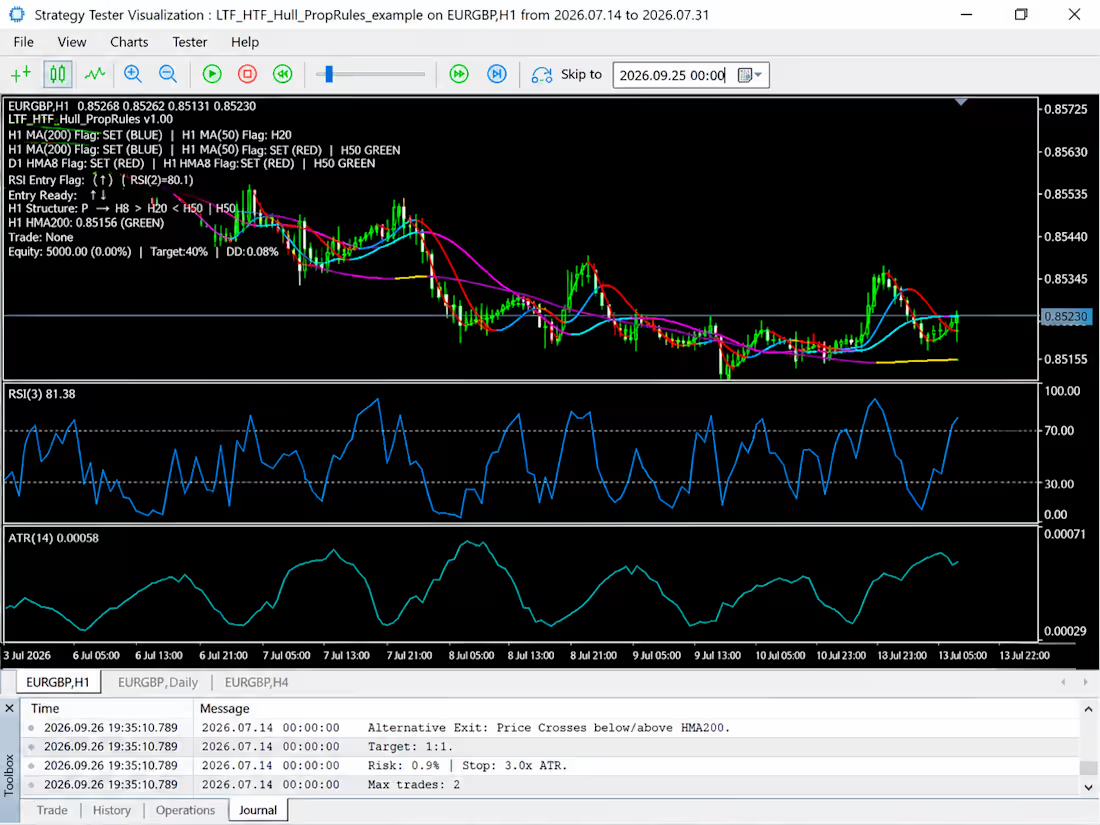
LTF_HTF_Hull_PropRules (the Prop Trader EA)
Multi-timeframe mean-reversion EA using an LTF → HTF approach. H1 HMA200 sets the directional anchor, H4 HMA20/HMA50 confirms structure, D1 HMA8 sets the higher-timeframe colour filter, and H1 RSI(3) times the entry. Each timeframe sets a persistent flag that remains valid until its own condition breaks; the EA only trades when all four flags agree on direction. Stop = 3× H1 ATR, target = 1:1. Includes a full prop-firm risk layer: profit-target kill switch, maximum total drawdown limit, optional daily drawdown limit, minimum valid trading days counter, and per-day CSV logging of every event. Requires the UnifiedHullMA indicator.(Note: This is for educational purposes only, it is not intended as a deployable strategy for the live market)
0
68