
Big Dwayne
Data Analyst || Power BI Dev
Ready for work
Big is ready for their next project!
Overview
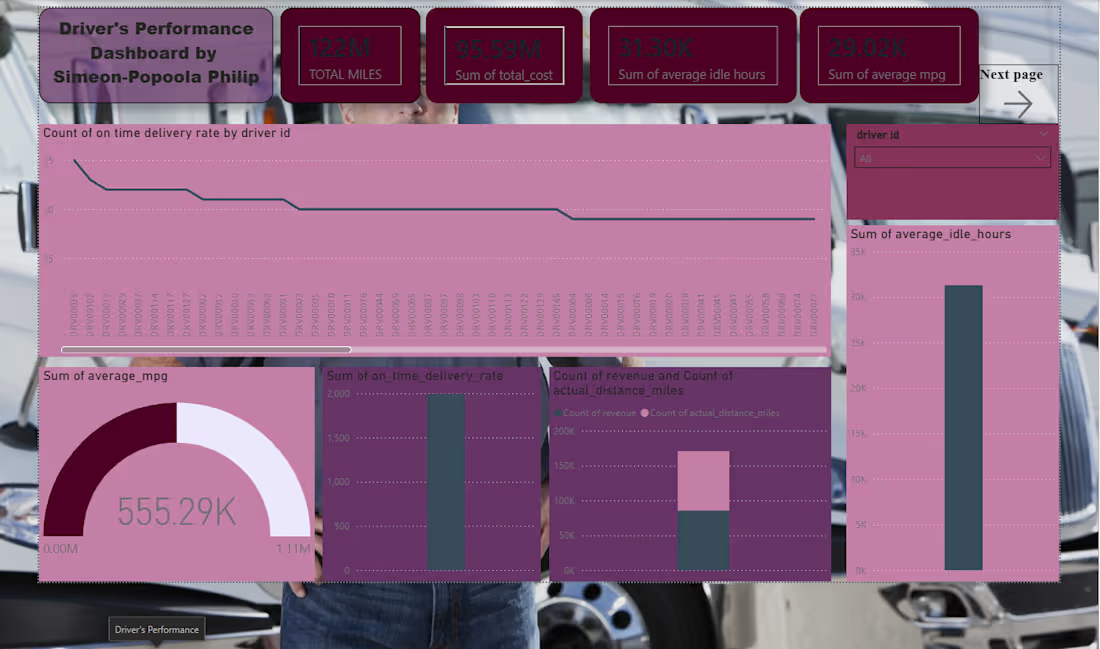
This interactive dashboard provides comprehensive insights into driver performance metrics, enabling fleet managers and logistics teams to monitor, analyze, and optimize driver operations effectively.
Features
Key Performance Indicators (KPIs)
TOTMILES - Total miles driven and total operational cost summary
TOTMINS - Average idle hours and average MPG metrics
TOTOK - Average MPG performance tracking
Data Visualizations
On-Time Delivery Rate by Driver ID
Bar chart visualization showing delivery performance distribution
Enables easy identification of top-performing and underperforming drivers
Revenue vs. Actual Distance Miles
Comparative analysis of revenue generation against actual distance covered
Helps assess driver efficiency and profitability
Driver Performance Metrics
Comprehensive view of on-time delivery rates
Average MPG performance tracking
Technical Specifications
Platform: Data visualization dashboard
Key Metrics Tracked:
Total miles
Operational costs
Idle hours
Fuel efficiency (MPG)
On-time delivery rates
Revenue generation
1
40
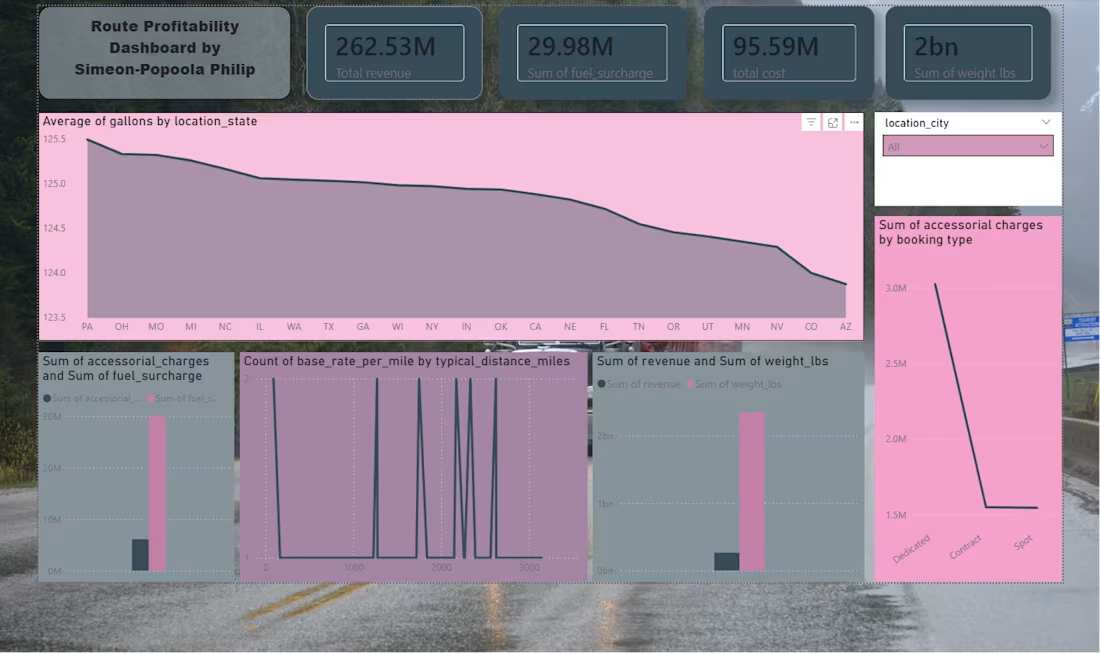
This project presents an interactive Route Profitability Dashboard built to analyze revenue, cost, fuel surcharge, and weight trends across different locations and booking types. It provides a clear visual summary of key logistics performance indicators to support better business decisions.
Project Overview
The dashboard gives an at-a-glance view of route performance by combining multiple metrics into one visual interface. It helps identify which locations, booking types, and distance ranges are contributing most to profitability and operational cost.
Key Insights
Total revenue: 262.53M. Total cost: 95.59M. Fuel surcharge: 29.98M. Total weight: 2bn lbs. Average gallons vary slightly by state, showing regional differences in route consumption. Booking type impacts accessory charges significantly, with dedicated routes appearing higher than contract and spot.
Dashboard Features
KPI cards for revenue, cost, fuel surcharge, and weight. Trend analysis by location state. Accessorial charge comparison by booking type. Distance-based analysis of base rate per mile. Interactive filter by city.
Tools Used
Microsoft Power BI.
Data visualization and business intelligence techniques. Route and logistics performance analysis.
1
31
Key Features
📊 Sales Metrics
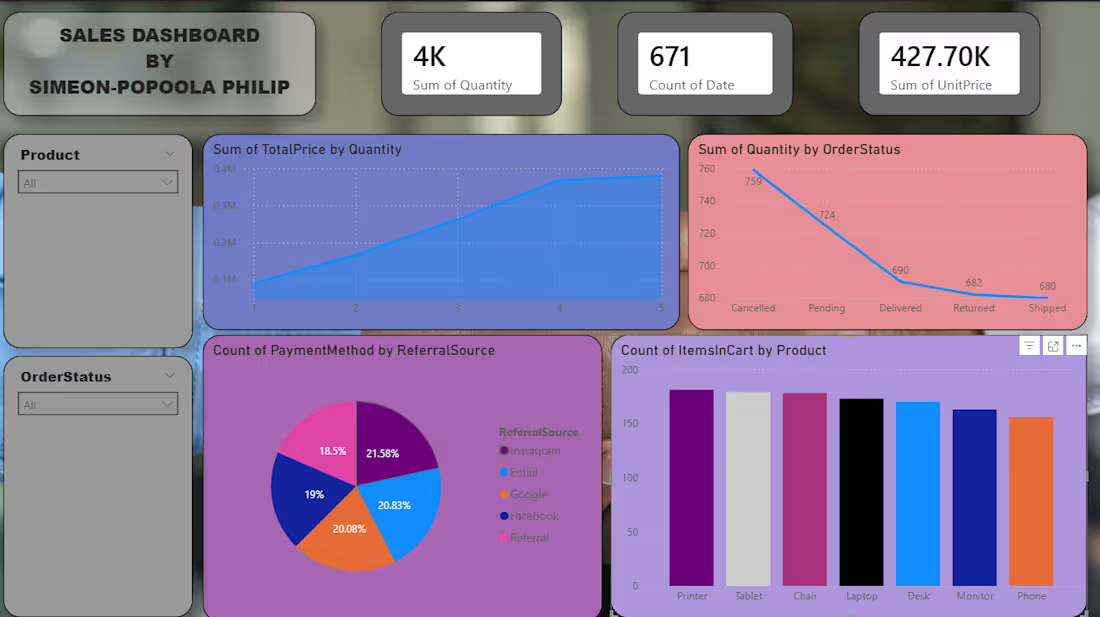
Total Quantity Sold: Track overall sales volume
Total Price by Quantity: Revenue analysis based on product quantity
Order Status Distribution: Monitor fulfillment status (Delivered, Shipped, Pending, Cancelled, Returned)
💳 Payment Analytics
Payment Method by Referral Source: Analyze how different marketing channels influence payment preferences
Payment Method by Referral Status: Understand payment behavior across customer segments
📦 Product Performance
Items in Cart by Product: Track popular products and shopping cart activity
Top Products: Monitor, Laptop, Phone, Tablet, Desk, Chair, Printer
🎯 Customer Insights
Referral Source Analysis: Performance metrics for Instagram, Email, Google, Facebook, and Referral channels
Customer Journey Tracking: From referral to purchase completion
1
23
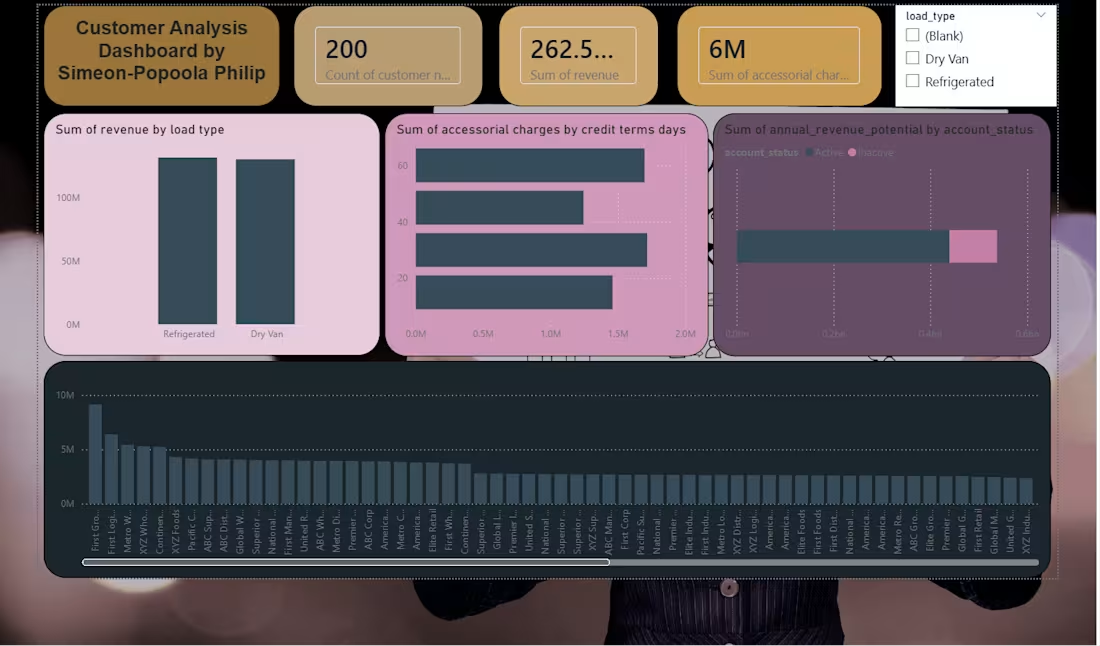
working on an interactive dashboard and an analytical examination of the dashboard
1
39