
Brandon Cooper
Operations, Documentation & Publishing Consultant
New to Contra
Brandon is building their profile!
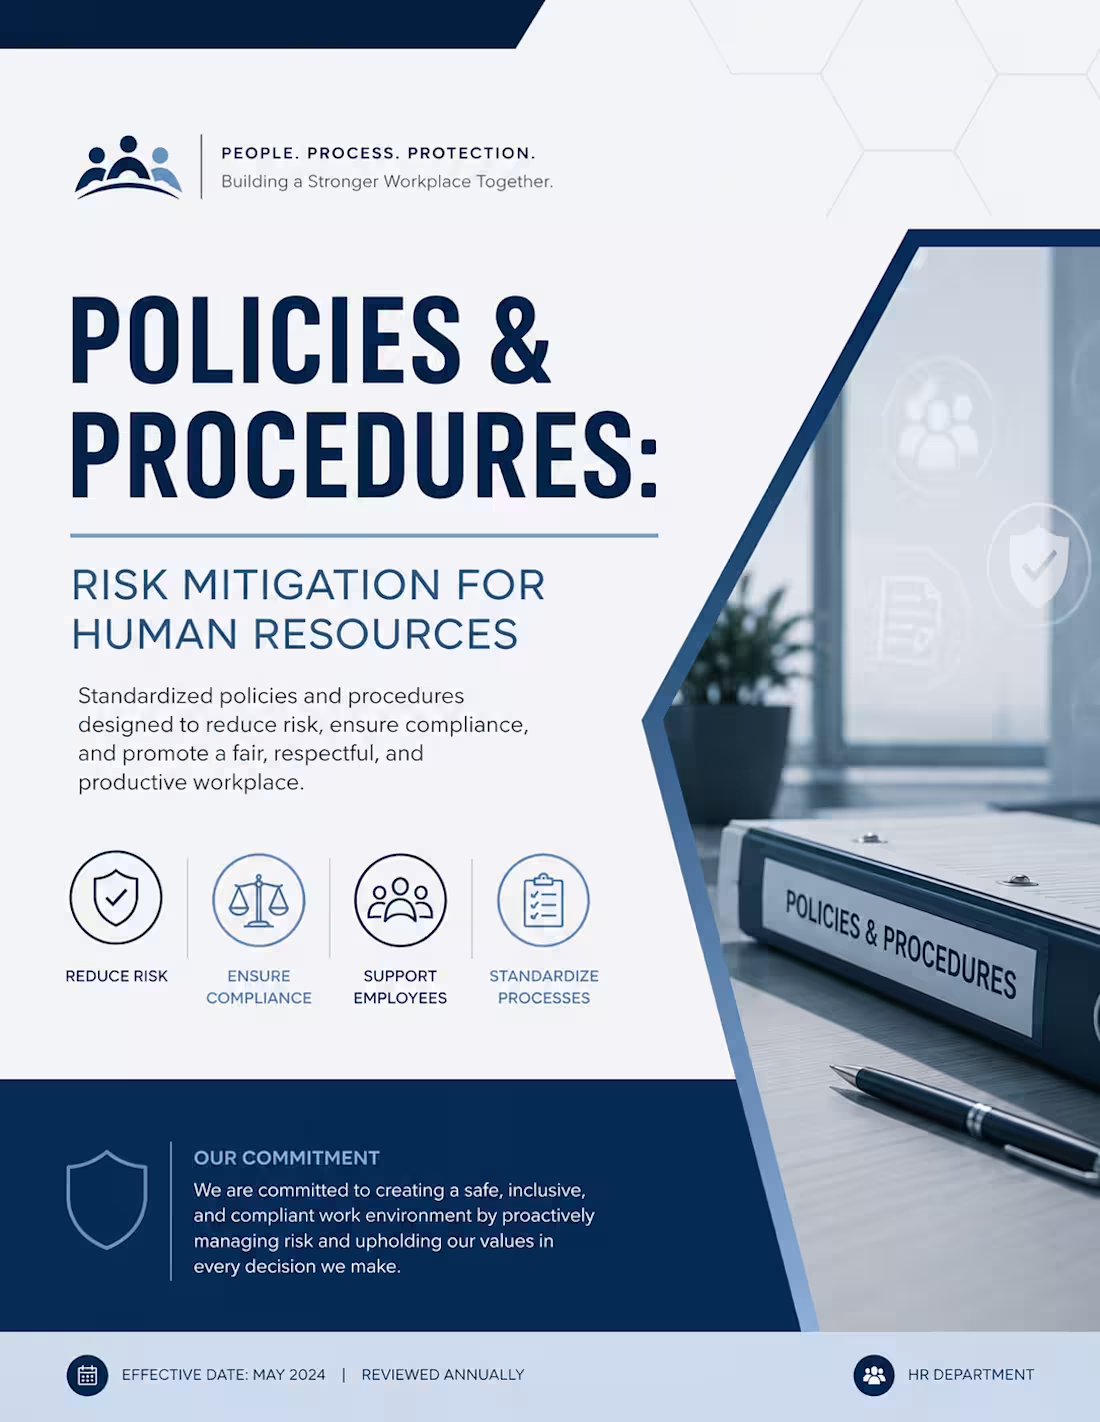
Human Resources Policies & Procedures Manual
The Challenge
Effective policies and procedures are essential for reducing organizational risk, ensuring regulatory compliance, and creating consistent employee experiences. As organizations grow, undocumented or inconsistent processes can increase legal exposure, create operational inefficiencies, and lead to inconsistent decision-making.
The Solution
I developed a comprehensive Human Resources Policies & Procedures manual designed to standardize key HR processes and support risk mitigation across the employee lifecycle. The document provides clear, actionable guidance that promotes consistency, accountability, and compliance while serving as a practical resource for managers and HR professionals.
The manual was designed with usability in mind, combining professional formatting, intuitive organization, and clearly documented procedures that are easy to navigate and maintain as organizational needs evolve.
Key features include:
Standardized HR policies and procedures
Process documentation and workflow guidance
Risk mitigation and compliance considerations
Consistent documentation standards
Professional document design and formatting
Scalable structure for future policy updates
This project demonstrates my ability to transform complex operational requirements into organized, user-friendly documentation that supports both day-to-day operations and long-term organizational governance.
Note: This portfolio sample was created to demonstrate document design, process documentation, and policy development capabilities. It is intended as a representative example and does not contain proprietary organizational information.
1
1
Performance Analytics & Claims Reporting Dashboard
The Challenge
As employee relations matters increased across multiple accounts and districts, leadership needed more than a simple list of open claims. They needed a way to identify trends, compare performance across business units, measure claim frequency, and understand where resources and risk were concentrated.
The Solution
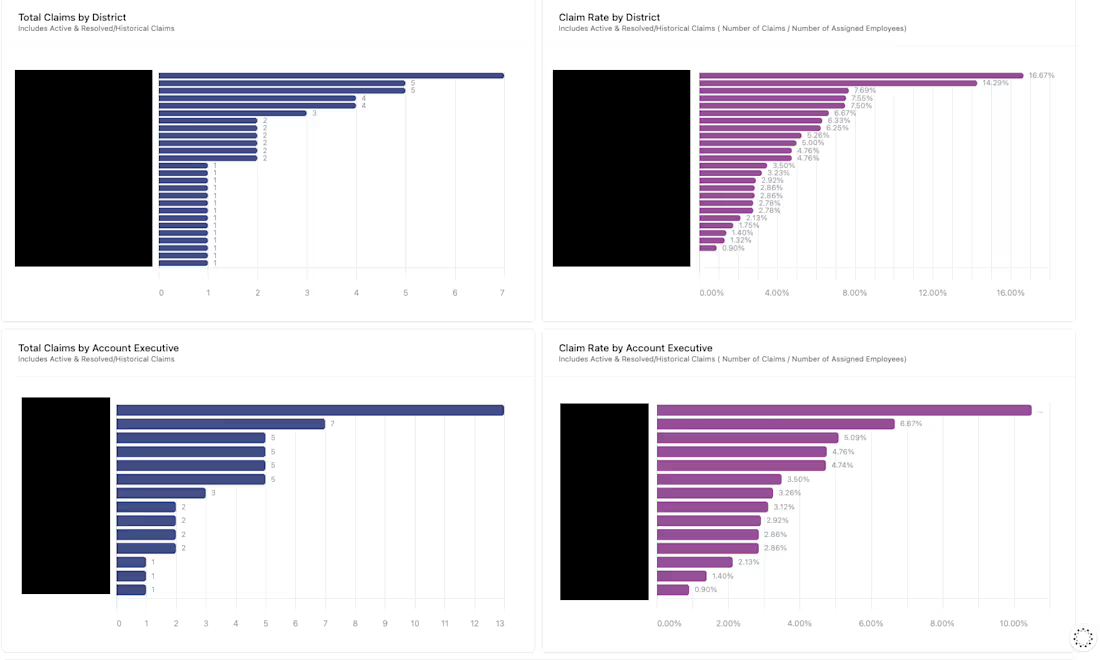
I designed a performance analytics dashboard that transforms operational data into actionable reporting for leadership. Built on a centralized claims database, the dashboard compares claim volume, claim rates, and performance across districts and account executives, allowing managers to identify patterns that would be difficult to recognize through raw data alone.
The reporting provides insight into:
Claims by district and geographic region
Claim rates relative to assigned employee populations
Claim volume by account executive
Comparative performance metrics across teams
Trends that support operational planning and resource allocation
By combining standardized data collection with interactive reporting, the dashboard provides leadership with a scalable framework for monitoring organizational performance, identifying opportunities for process improvement, and supporting data-informed decision-making.
Note: Dashboard images shown in this portfolio use modified and/or fictionalized data to protect confidential information while accurately demonstrating the reporting system and dashboard functionality.
1
6
The Challenge
Employee relations and legal matters involve a significant amount of information—from case status and deadlines to financial exposure, jurisdictional differences, and reporting requirements. Without a centralized system, tracking these details consistently can become time-consuming, limit visibility into active matters, and make executive reporting more difficult.
The Solution
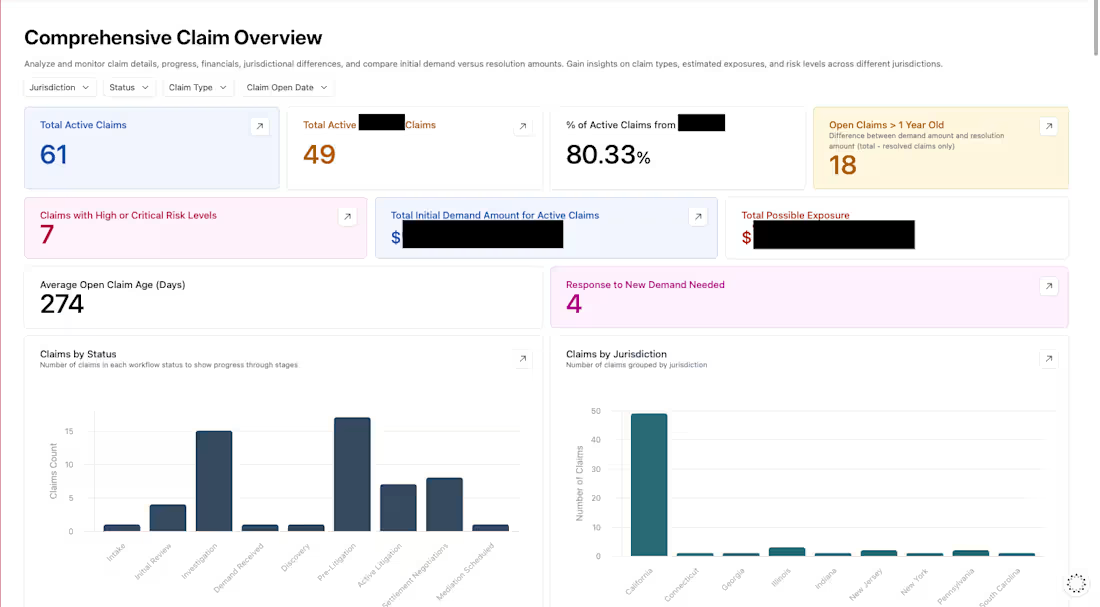
To address these challenges, I designed a centralized claims management database and executive reporting dashboard that organizes key information into a single, structured workflow. The system standardizes case records, tracks important milestones and deadlines, captures financial and operational metrics, and provides leadership with real-time visibility into workload, risk, and claim trends.
The dashboard was designed to answer operational questions at a glance, including:
How many claims are currently active?
Where are cases within the workflow?
Which matters present the highest risk?
What financial exposure exists across active claims?
How are claims distributed across jurisdictions?
Which cases require immediate attention or have remained open beyond expected timeframes?
By consolidating data into a single reporting interface, the system supports more informed decision-making, improves consistency in documentation, and provides a scalable foundation for ongoing reporting and process improvement.
Note: Dashboard images shown in this portfolio use modified and/or fictionalized data to protect confidential information while accurately demonstrating the system's design and functionality.
0
12