
Lia Rabin
Power BI Expert | Data Product Manager | UX/UI Designer
- 1
- Followers

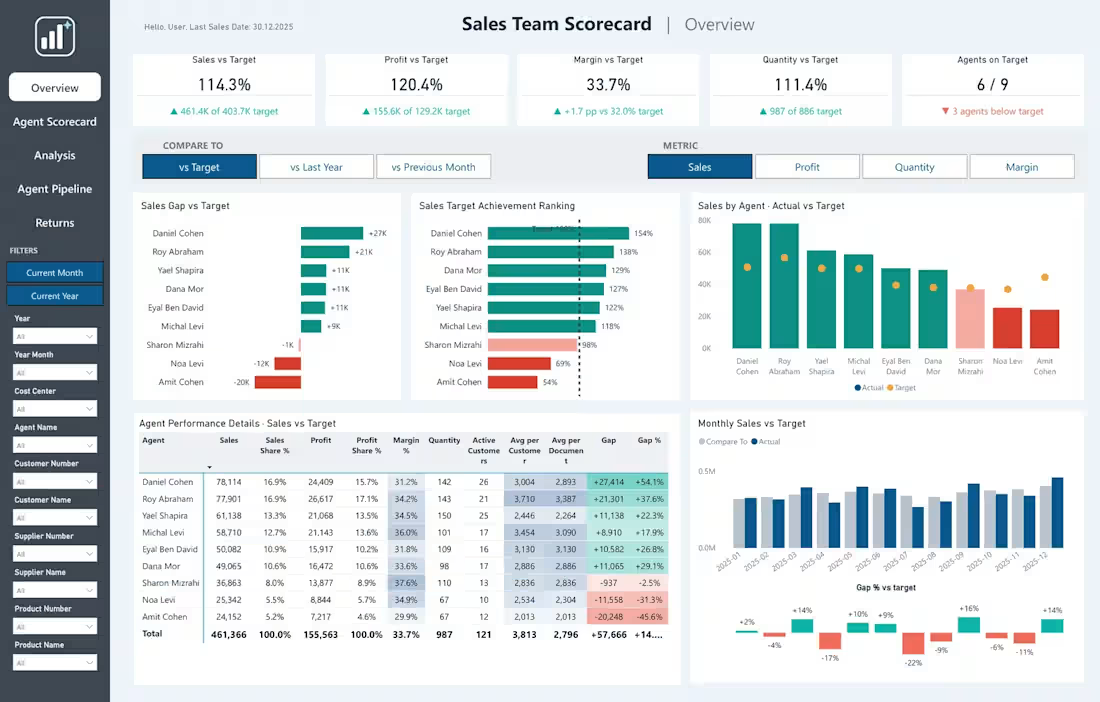
Sales Team Scorecard | Power BI Agent Performance vs Target. Every agent measured against target, with one click switches between Target, Last Year and Previous Month and between Sales, Profit, Quantity and Margin. Includes a month end forecast, required sales per day, Agent Pipeline (quotes to orders), Performance Analysis and Returns, plus a phone layout.
0
3
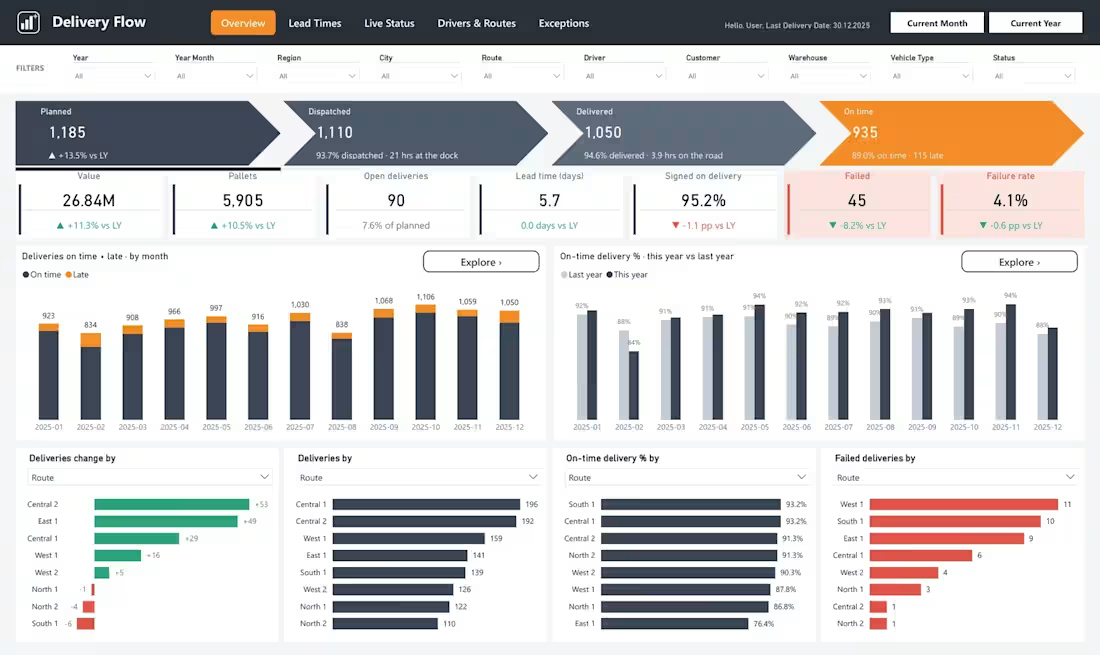
Delivery Flow: Order to Doorstep | Power BI Logistics Analytics. Follows every delivery from Planned to Dispatched, Delivered and On time, across five screens: Overview, Lead Times, Live Status, Drivers & Routes and Exceptions. Late, failed and unsigned deliveries surface immediately, with the reasons behind them.
0
6
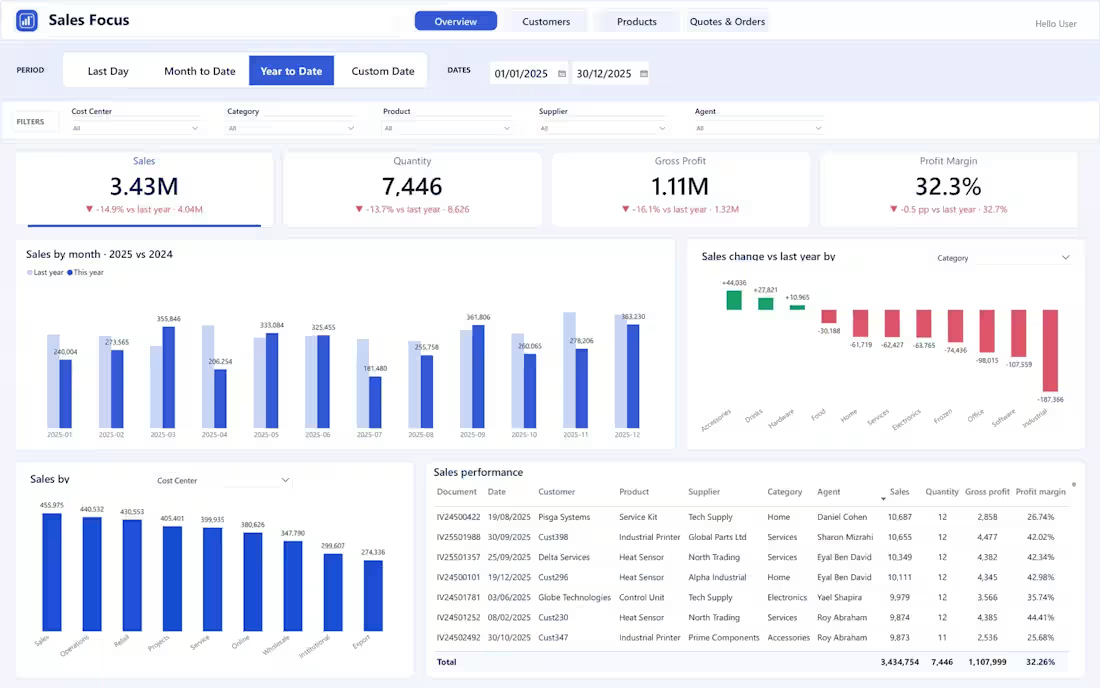
Sales Focus | Interactive Power BI Sales Analytics. One click period buttons (Last Day, Month to Date, Year to Date, Custom Date) and clickable KPI cards that switch every chart to the selected metric. Four screens: Overview, Customers, Products, and Quotes & Orders, all compared to last year.
0
9