
Birra Kounain
Financial Data Analyst & Dashboard Specialist
New to Contra
Birra is ready for their next project!
Global Fulfillment Operations & Customer Retention Command Center
Project Description
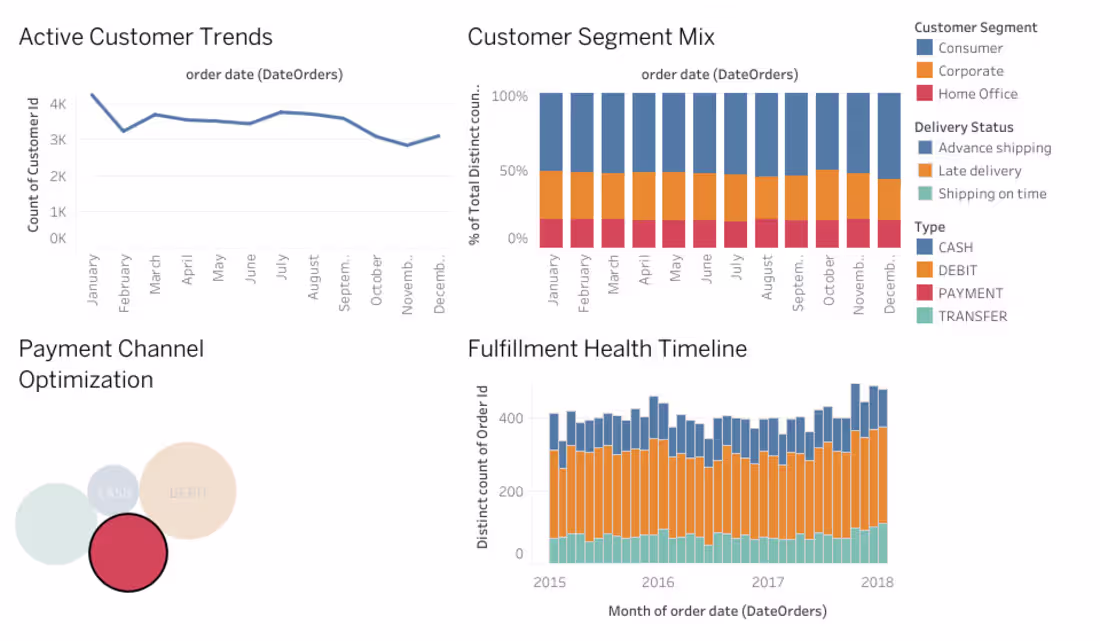
This end-to-end business intelligence project addresses a critical challenge for modern global enterprises: aligning payment channel data with supply chain performance and customer retention behavior.
Using a real-world multi-country transactional fulfillment dataset, this interactive command center consolidates executive KPIs into a unified digital landscape. The dashboard monitors year-over-year active customer volumes, tracks the percentage distribution of key market segments, and isolates high-volume transaction channels using modern UI bubble charts. Crucially, the engine provides leadership with a deep-dive timeline into logistical health—visualizing late deliveries, cancellations, and on-time shipments—allowing managers to pinpoint operational bottlenecks, protect business margins, and proactively reduce customer churn.
💼 My Role
Lead Business Intelligence (BI) Developer & Data Analyst
Owned the full development lifecycle, transforming raw, dense data files into an executive-ready visual product.
Designed the dashboard wireframe and user flow to balance high-level corporate KPIs with deep-dive logistical operational trends.
Tested and optimized data processing speeds to ensure instantaneous visual recalculations upon user filtering.
0
2
Project Title
Global Retail Command Center: Supply Chain Optimization & Margin Protection
Project Role
Lead Business Intelligence (BI) Developer
Project Description
Overview
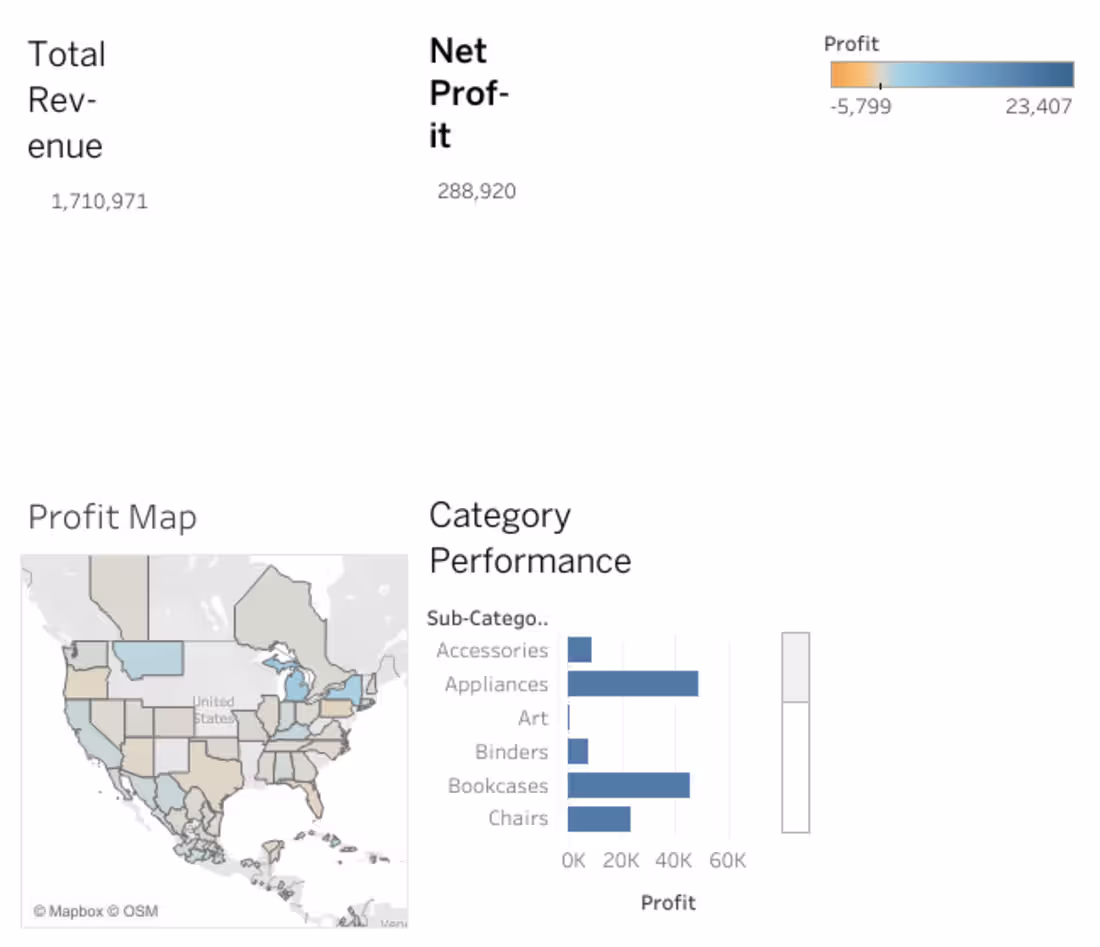
Engineered an enterprise-level global retail operations dashboard in Tableau using complex transaction logs. This system translates massive operational data into clean, interactive executive insights to identify logistics inefficiencies and protect profit margins across international markets.
Core Deliverables:
Financial Health Tracking: Built dynamic KPI indicators summarizing high-level metrics including Net Revenue and Total Profit Margins to give executives instant visibility.
Geospatial Profit Map: Developed an interactive geographic overlay to isolate international territories and states operating at a loss due to hidden shipping overhead.
Product Performance Analytics: Structured cross-filtering visual sheets allowing operational managers to instantly pinpoint which specific product sub-categories are actively draining company profits.
Tools Used:
Tableau, Data Visualization, Business Intelligence (BI), Operations Analytics.
0
11
Project Title
Executive Financial Performance & Operations Dashboard
Project Overview
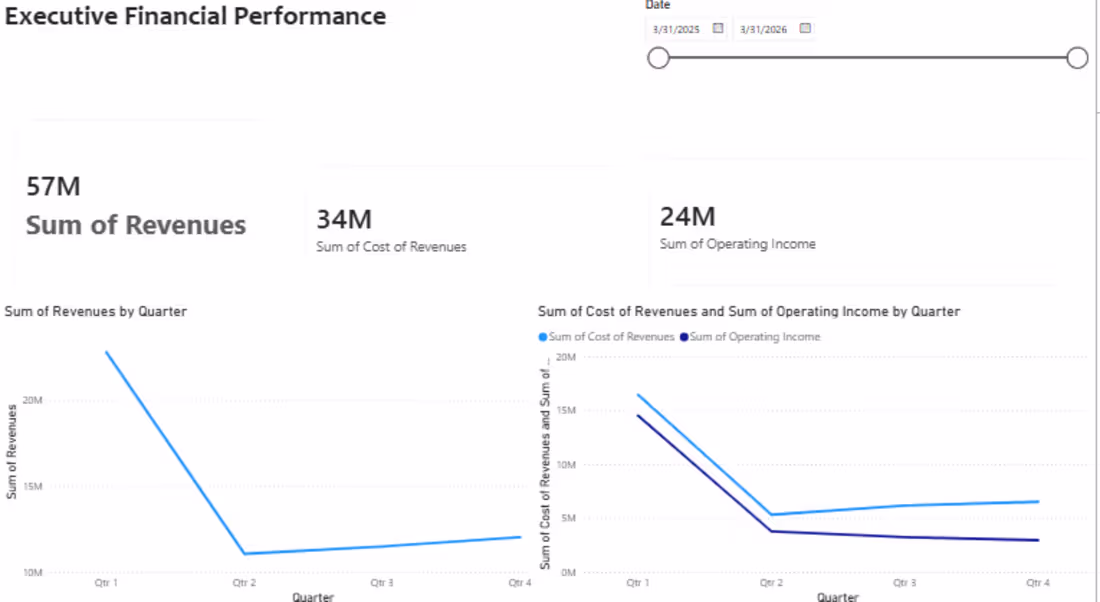
Developed a comprehensive, interactive corporate financial dashboard in Power BI to track key organizational metrics, revenue trends, and operational costs. The project involved transforming raw data into an executive-level visual report, enabling leadership to make data-driven decisions regarding profitability and quarterly financial health.
My Role
Data Analyst & Business Intelligence Developer
Data Modeling & Architecture: Connected financial data points to establish a clean data structure for accurate calculation.
Dashboard Layout & UX Design: Architected the complete visual layout from scratch, ensuring a professional corporate skeleton with intuitive navigation.
KPI & Metric Configuration: Built and formatted essential executive KPI cards (including Sum of Revenues, Cost of Revenues, and Operating Income) utilizing automated display units ($M$).
Interactive Analytics: Implemented a dynamic Date Slicer and interactive timeline controllers to allow users to filter metrics by custom periods.
Data Visualization: Created synchronized quarterly trend line charts to track financial performance shifts across specific fiscal quarters.
Project Details & Metrics
Tools Used: Power BI Desktop, Data Modeling, Data Visualization, Dashboard Design.
Key Deliverables:
An executive header and streamlined navigation layout.
High-level KPI blocks displaying primary financial health indicators ($57\text{M}$ Revenue metrics).
Side-by-side quarterly trend charts comparing revenues against operating costs and income.
An interactive timeline controller for dynamic time-period filtering.
1
33
Project Title
Enterprise Financial Health & Risk Command Center
Project Overview
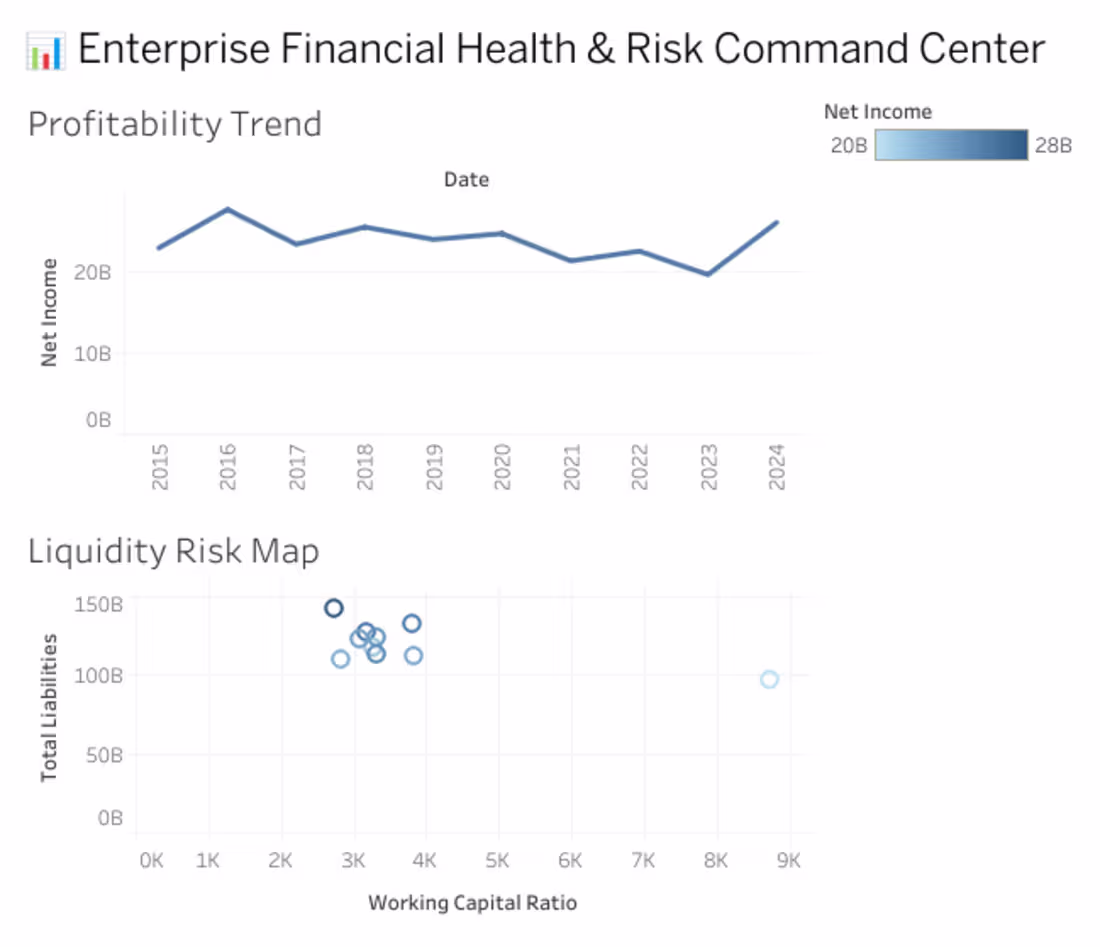
Engineered a comprehensive, interactive business intelligence dashboard using raw corporate financial datasets sourced from Kaggle. The goal of this project was to establish a centralized "Command Center" that bridges operational bottom-line metrics with enterprise balance sheet liabilities for high-level executive review.
The Technical & Analytical Process
Data Engineering & Preparation: Processed, extracted, cleaned, and structured unorganized raw financial logs to build a reliable data model mapping Net Income timelines against liability structures.
Interactive Risk Mapping: Designed custom action filters within a scatter plot framework. As shown in "Dashboard 1 (1).png", this allows stakeholders to actively select specific liquidity risk outliers on the Liquidity Risk Map (comparing Total Liabilities against Working Capital Ratio) to instantly filter and update corresponding multi-year Profitability Trends.
C-Suite Design Standards: Optimized the dashboard layout using a minimalist, corporate-friendly color palette (structured around graded blue-scale metrics for Net Income ranges from 20B to 28B) ensuring the visual assets meet strict presentation standards for executive board reviews.
1
51