
Banwari Kumawat
Data Analyst | Excel Dashboards, Data Cleaning & Insights
New to Contra
Banwari is building their profile!
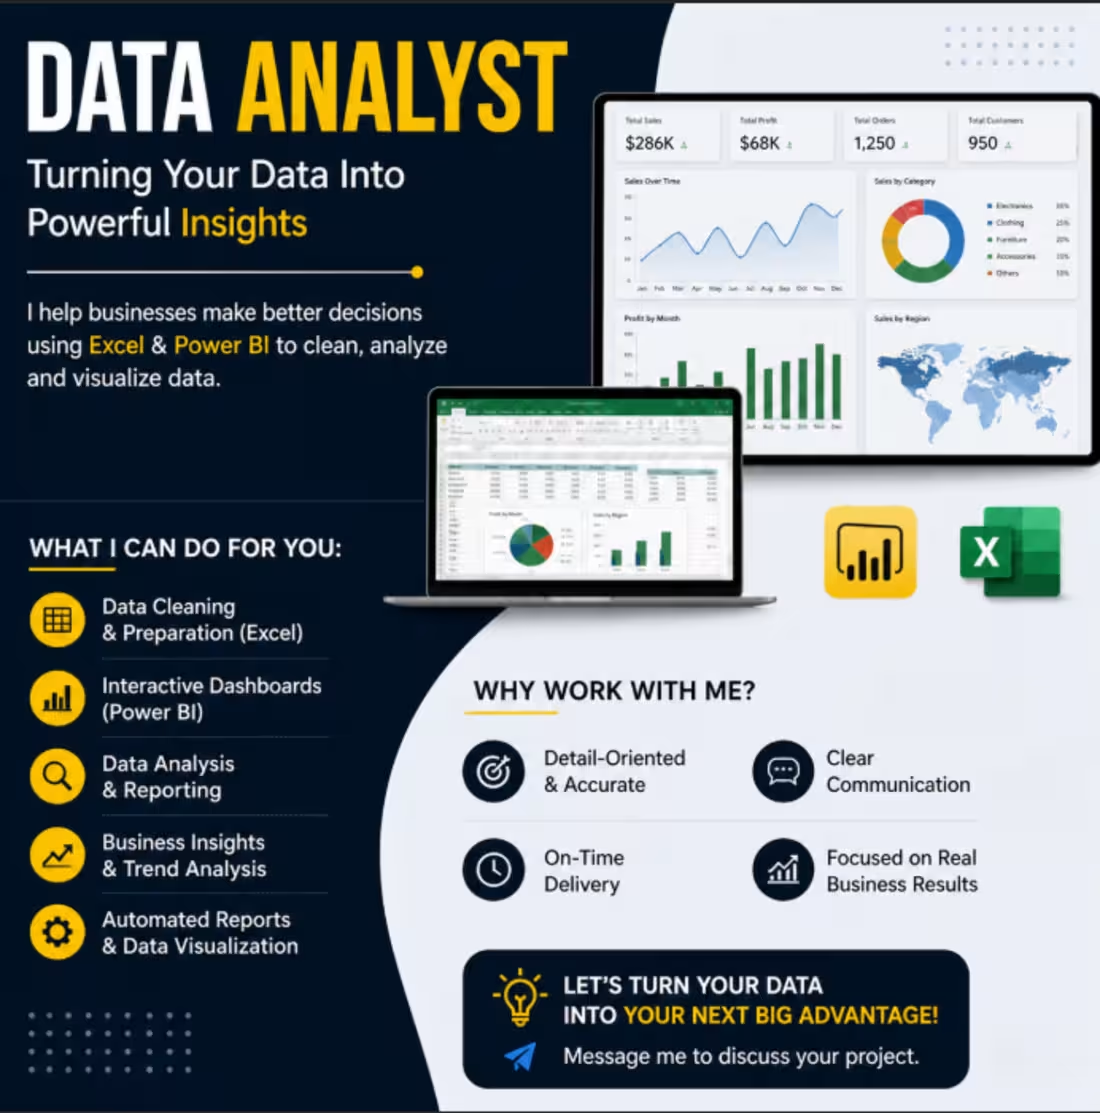
🚀 Turn Your Data into Powerful Insights
Are you struggling to understand your data or make better business decisions? I’m here to help!
I’m a Data Analyst specializing in Excel and Power BI, and I help businesses transform raw data into clear, actionable insights.
💼 What I can do for you:
✔ Data Cleaning & Preparation (Excel)
✔ Interactive Dashboards (Power BI)
✔ Data Analysis & Reporting
✔ Sales & Business Insights
✔ Automated Reports
📊 Whether you have messy data or need a professional dashboard, I can turn your data into something meaningful and easy to understand.
🎯 Why work with me?
✔ Detail-oriented & reliable
✔ Clear communication
✔ On-time delivery
✔ Focused on real business results
Let’s work together to unlock the full potential of your data.
📩 Feel free to message me to discuss your project!
0
9
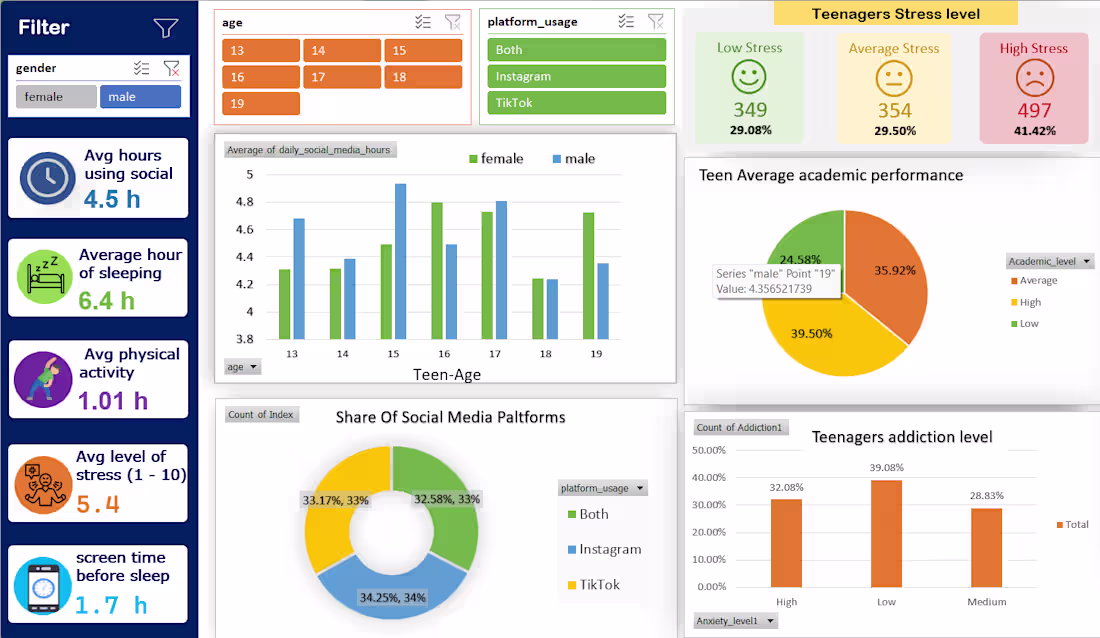
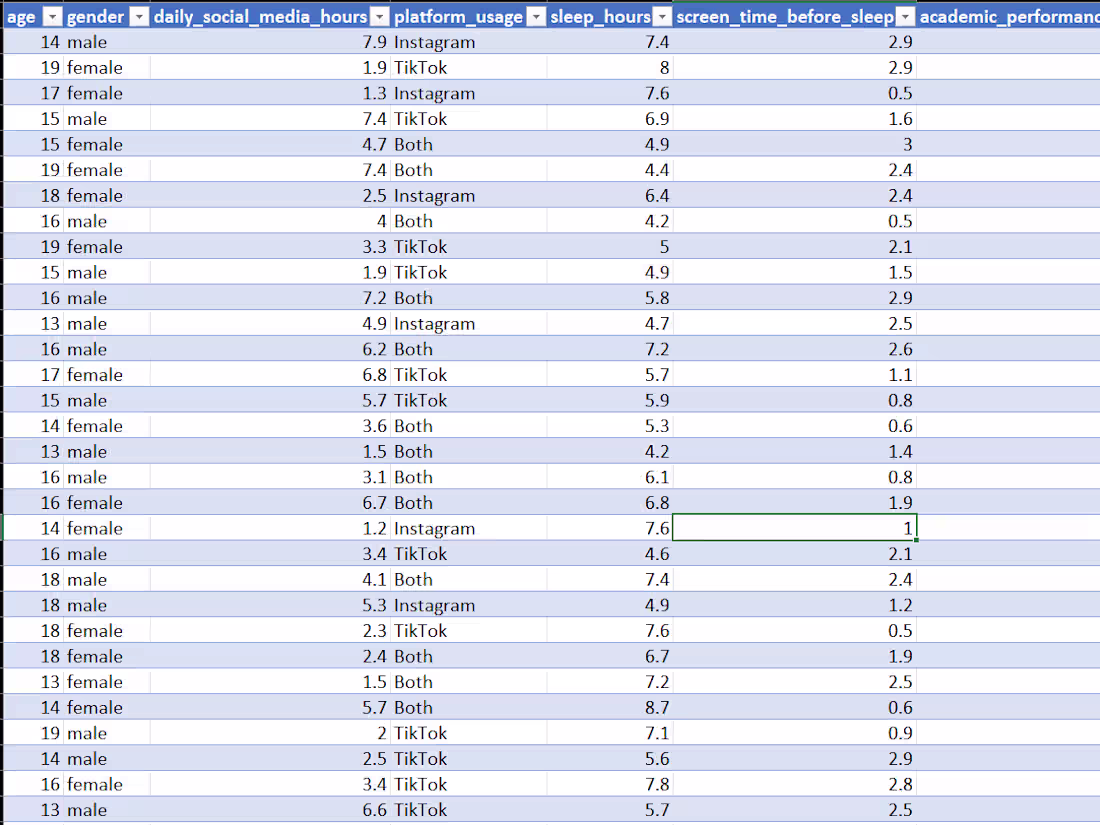
This project focuses on analyzing teen mental health data to understand how factors like screen time, social interaction, and daily habits impact overall well-being.
Using Microsoft Excel, I cleaned and organized the dataset, then applied data analysis techniques to identify patterns and trends. I created Pivot Tables and interactive dashboards to visualize key insights in a simple and clear way.
🔹 Key Analysis:
• Relationship between screen time and stress levels
• Impact of social interaction on mental health
• Categorization of mental health levels (Low, Medium, High)
• Trend analysis based on behavioral data
🔹 Tools & Techniques:
• Microsoft Excel
• Data Cleaning
• Pivot Tables & Charts
• Dashboard Creation with Slicers
• Excel Formulas (IF, COUNTIF, etc.)
🔹 Key Insights:
• Higher screen time is associated with increased stress levels
• Balanced social interaction contributes to better mental health
• Data visualization helps in understanding behavioral patterns effectively
This project demonstrates my ability to transform raw data into meaningful insights and create user-friendly dashboards that support data-driven understanding.
0
9
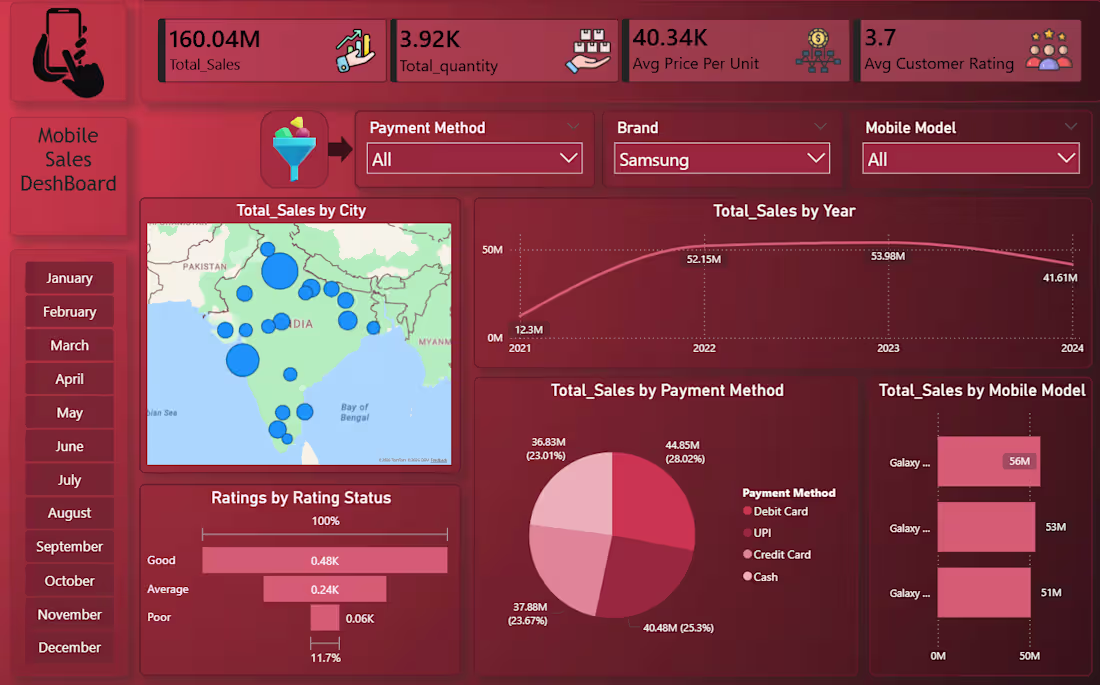
This project focuses on analyzing mobile sales data using Power BI to identify key trends, product performance, and revenue insights.
I cleaned and prepared the dataset, then built an interactive dashboard to visualize sales across different brands, models, and regions. The dashboard includes KPIs, charts, and filters to help users easily explore the data and make informed decisions.
🔹 Key Highlights:
• Sales performance by brand and model
• Region-wise revenue analysis
• Trend analysis over time
• Interactive filters for dynamic insights
🔹 Tools Used:
• Power BI
• Data Cleaning & Transformation
• Data Visualization
This project demonstrates my ability to create interactive dashboards and turn raw data into clear, actionable business insights.
0
13
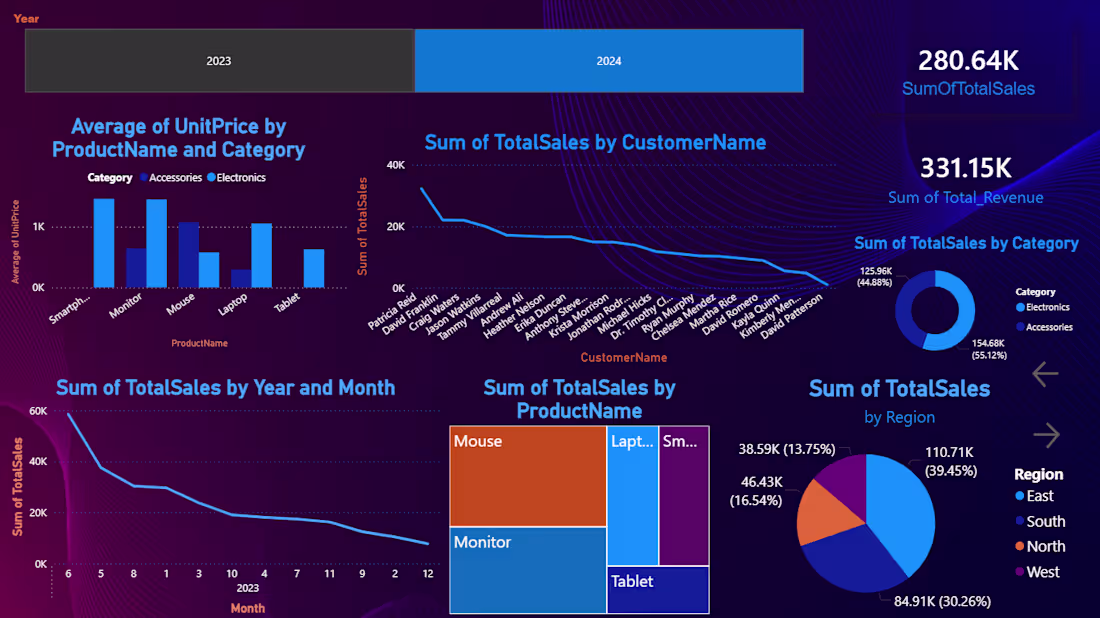
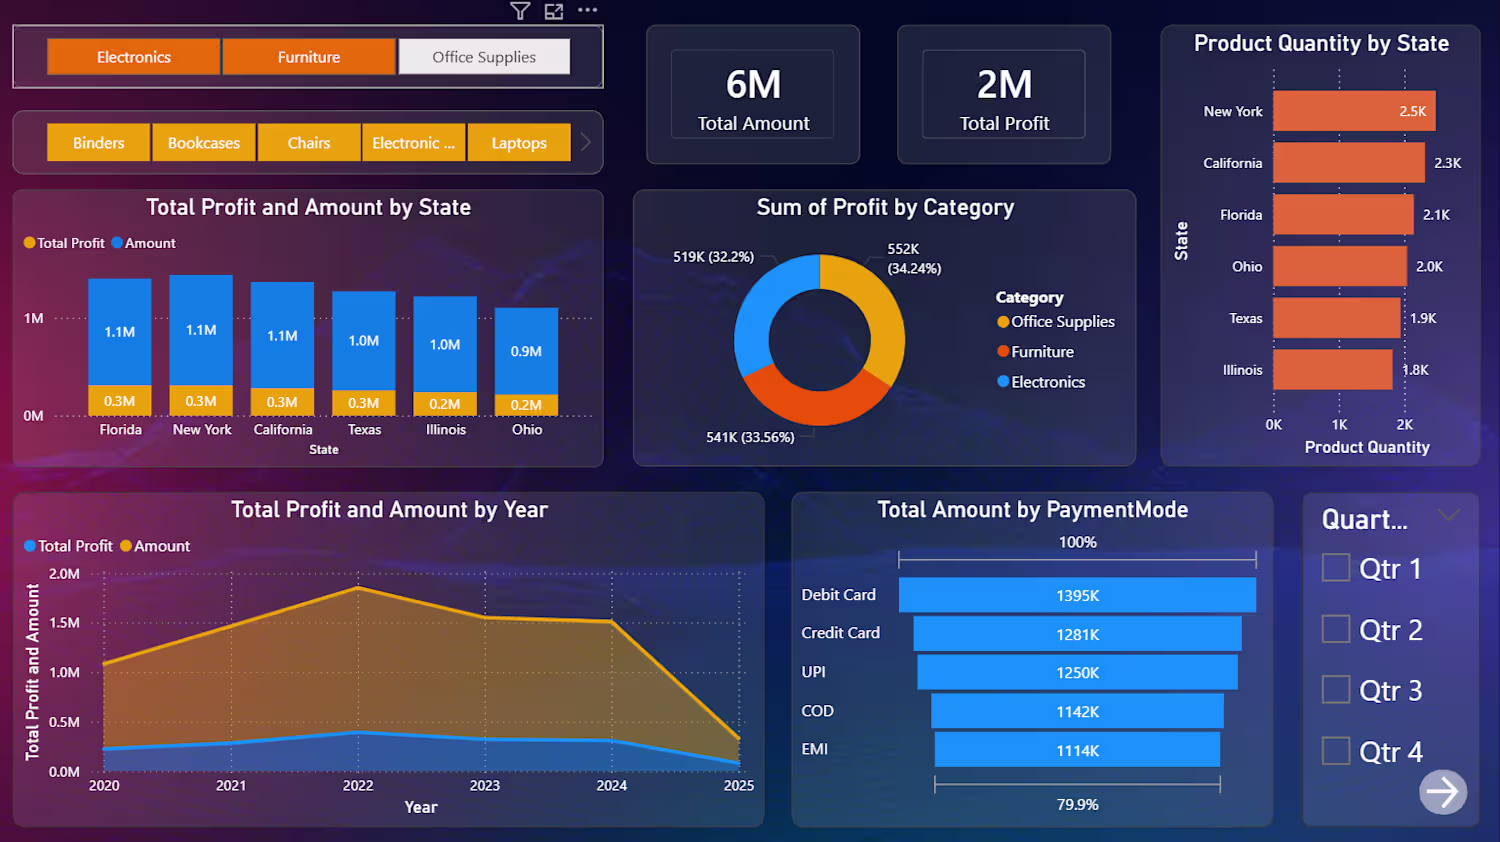
This project focuses on analyzing sales data to uncover trends, evaluate performance, and generate actionable insights for business growth.
Using Microsoft Excel, I cleaned and structured the dataset, then performed detailed analysis to understand sales patterns across different products, regions, and time periods. I created Pivot Tables and interactive dashboards to present the data in a clear and visually engaging way.
🔹 Key Analysis:
• Sales trends over time (monthly/yearly performance)
• Top-performing products and categories
• Region-wise sales comparison
• Customer segment analysis
• Revenue and quantity relationship
🔹 Tools & Techniques:
• Microsoft Excel
• Data Cleaning & Preparation
• Pivot Tables & Charts
• Dashboard Creation with Slicers
• Excel Formulas (SUMIFS, IF, VLOOKUP, etc.)
🔹 Key Insights:
• Identified top revenue-generating products and regions
• Discovered seasonal trends affecting sales performance
• Highlighted areas with growth potential and improvement opportunities
This project demonstrates my ability to transform raw sales data into meaningful insights and build interactive dashboards that support data-driven decision-making.
0
16
Teen Mental Health Data Analysis (Excel)
This project focuses on analyzing teen mental health data to understand how factors like screen time, social interaction, and daily habits impact overall well-being.
Using Microsoft Excel, I cleaned and organized the dataset, then applied data analysis techniques to identify patterns and trends. I created Pivot Tables and interactive dashboards to visualize key insights in a simple and clear way.
🔹 Key Analysis:
• Relationship between screen time and stress levels
• Impact of social interaction on mental health
• Categorization of mental health levels (Low, Medium, High)
• Trend analysis based on behavioral data
🔹 Tools & Techniques:
• Microsoft Excel
• Data Cleaning
• Pivot Tables & Charts
• Dashboard Creation with Slicers
• Excel Formulas (IF, COUNTIF, etc.)
🔹 Key Insights:
• Higher screen time is associated with increased stress levels
• Balanced social interaction contributes to better mental health
• Data visualization helps in understanding behavioral patterns effectively
This project demonstrates my ability to transform raw data into meaningful insights and create user-friendly dashboards that support data-driven understanding.
1
2
102
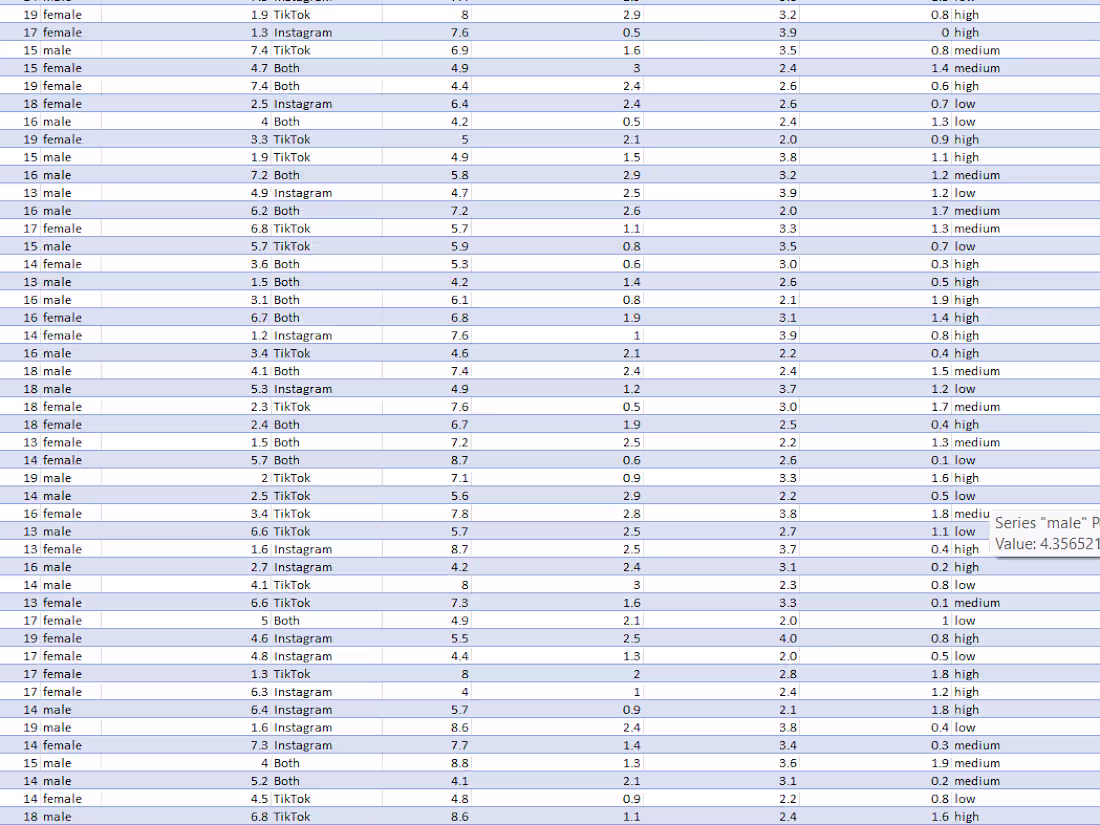
In this project, I analyzed a teen mental health dataset using Microsoft Excel to identify patterns and insights related to stress levels, screen time, and social interaction.
🔹 Key Work:
• Cleaned and organized raw data for analysis
• Created Pivot Tables to summarize key metrics
• Built interactive dashboards using charts and slicers
• Analyzed relationships between screen time and mental health levels
• Categorized data into Low, Medium, and High impact levels
🔹 Insights:
• Higher screen time is linked with increased stress levels
• Balanced social interaction shows better mental health outcomes
• Data visualization helps in understanding behavioral patterns
🔹 Tools Used:
• Microsoft Excel
• Pivot Tables
• Charts & Slicers
• Data Cleaning Techniques
This project demonstrates my ability to transform raw data into meaningful insights using Excel.
0
15