AYUSH AGRAWAL
Excel Expert for Accurate Data & PDF Solutions
New to Contra
AYUSH is ready for their next project!


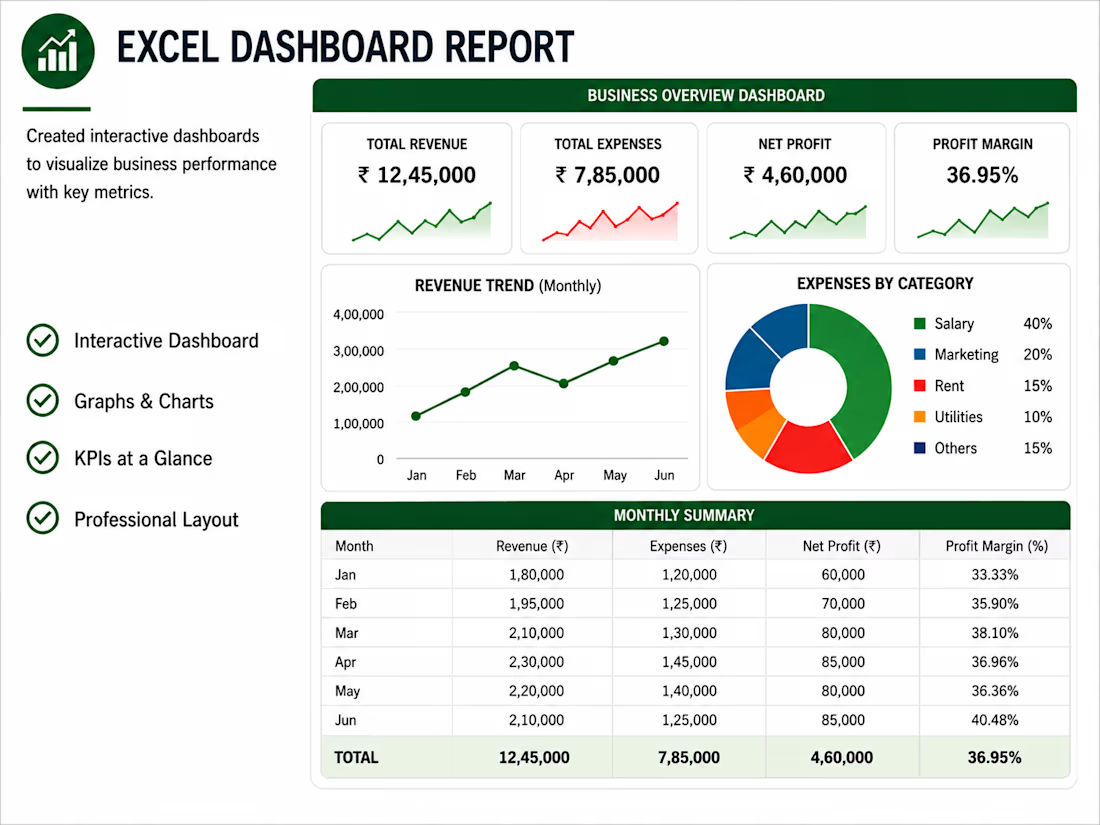
I designed an interactive Excel dashboard to present business performance through clear charts, KPIs, and summary reports. The dashboard enables users to monitor important metrics at a glance and make faster, data-driven decisions.


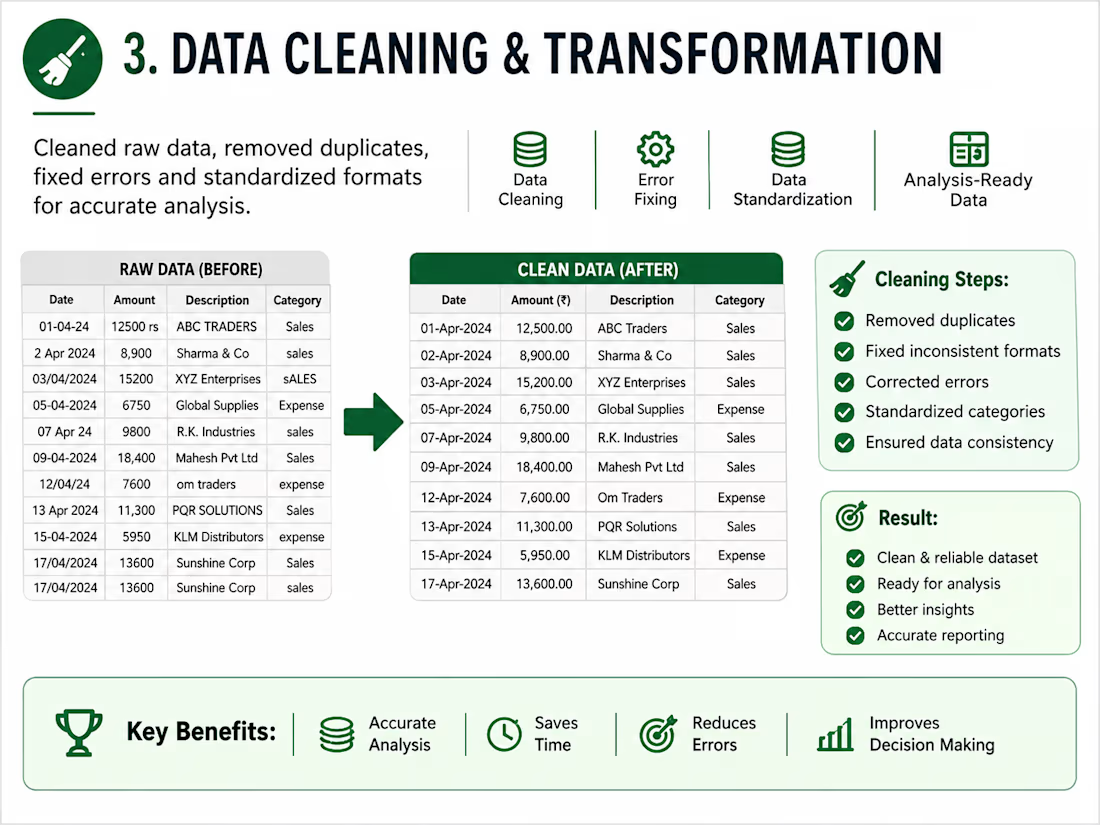
I transformed an unorganized dataset into a clean, standardized, and analysis-ready spreadsheet by removing duplicates, correcting inconsistencies, and formatting the data. The result was a reliable dataset that clients could confidently use for reporting and decision-making.
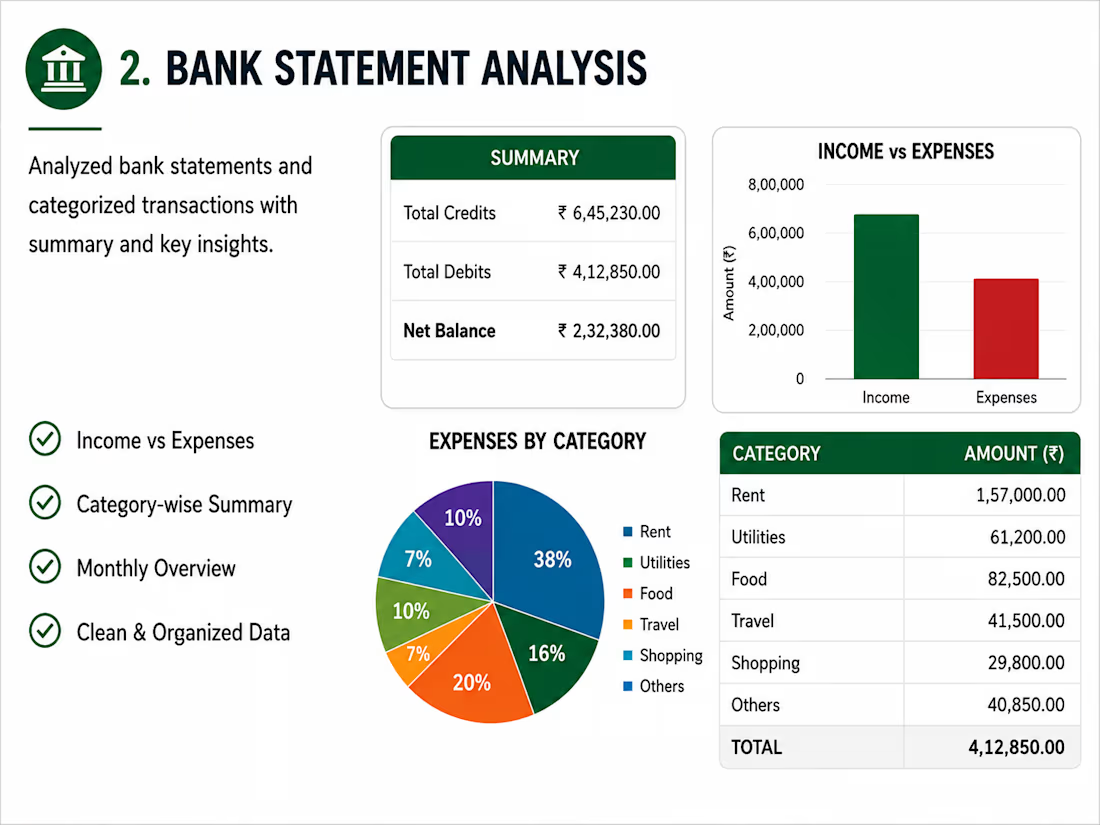
This project involved converting bank statement data into a structured Excel report and categorizing every transaction. I created summaries, charts, and key financial insights, making it easier to track income, expenses, and cash flow.
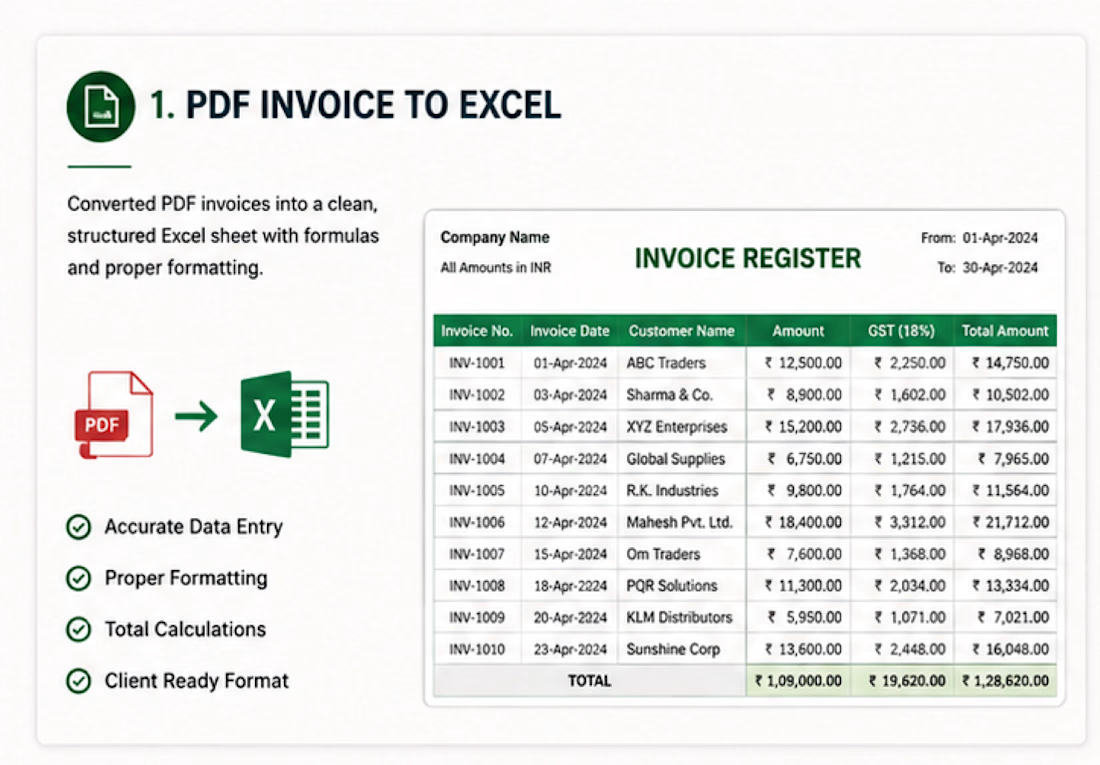
I converted a complex PDF invoice into a fully editable Excel workbook with clean formatting, formulas, and structured tables. The final file was organized for easy analysis, saving manual data entry time while ensuring accuracy and consistency.