
Arif Kanjirapuzha
Data Analyst | Excel & Power BI dashboards expert
New to Contra
Arif is building their profile!

Dashboard Description – Performance Tracker
This Performance Tracker Dashboard presents a consolidated view of annual sales performance, growth indicators, and operational trends for a smartwatch product line.
At the top, key Year-to-Date (YTD) KPIs—including Sales 2023, Sales 2022, and Budget 2023—are highlighted with directional indicators to show progress and variance. The dashboard also visualizes category-level and segment-level growth rates through circular progress visuals, making year-over-year performance immediately understandable.
Sales by Segment is displayed through a monthly bar chart, showing how different periods contribute to total revenue.
Orders by Month uses a smooth line graph to track order volume trends, highlighting seasonal peaks and demand patterns.
3
173
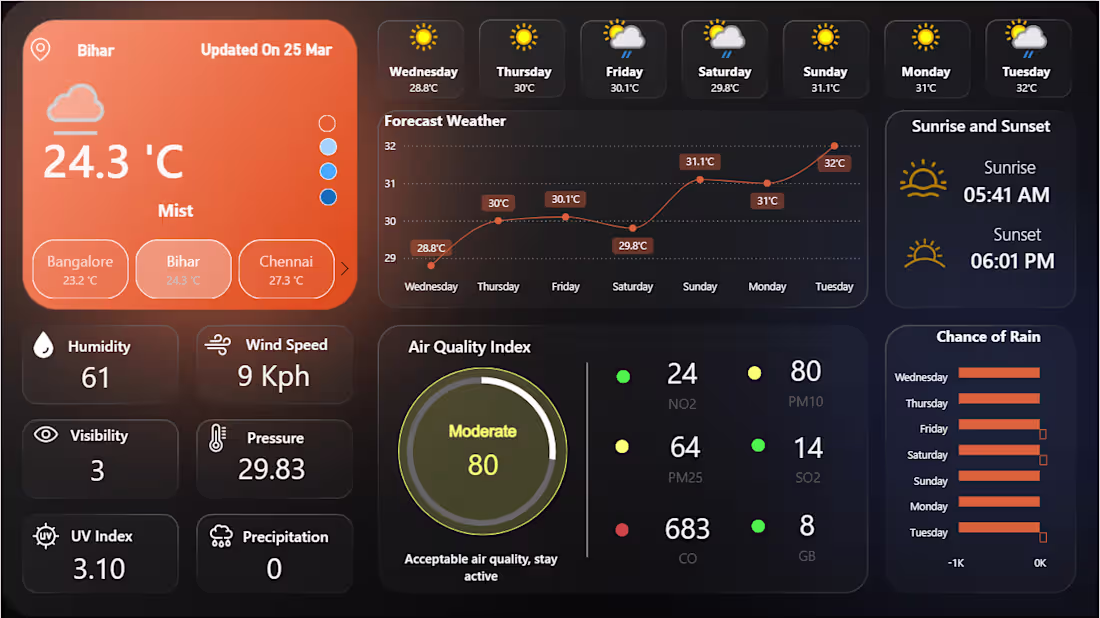
Weather Analytics Dashboard – Multi-City Monitoring (Bihar, Bangalore, Chennai, Kerala, Mumbai, Hyderabad)
This interactive weather dashboard provides a comprehensive real-time view of atmospheric and environmental conditions across major Indian cities such as Bihar, Bangalore, Chennai, Kerala, Mumbai, and Hyderabad. The interface is structured for rapid situational awareness, combining current weather metrics, forecasts, air-quality insights, and sunrise–sunset information in a single unified layout.
1. Current Weather Overview
2. Key Atmospheric Indicators
3. 7-Day Forecast Module
4. Sunrise & Sunset Timing
5. Air Quality Index (AQI) Panel
Overall Purpose
It is ideal for:
Daily weather planning
Travel and logistics
AQI awareness
Agriculture
Data-driven environmental monitoring
3
162
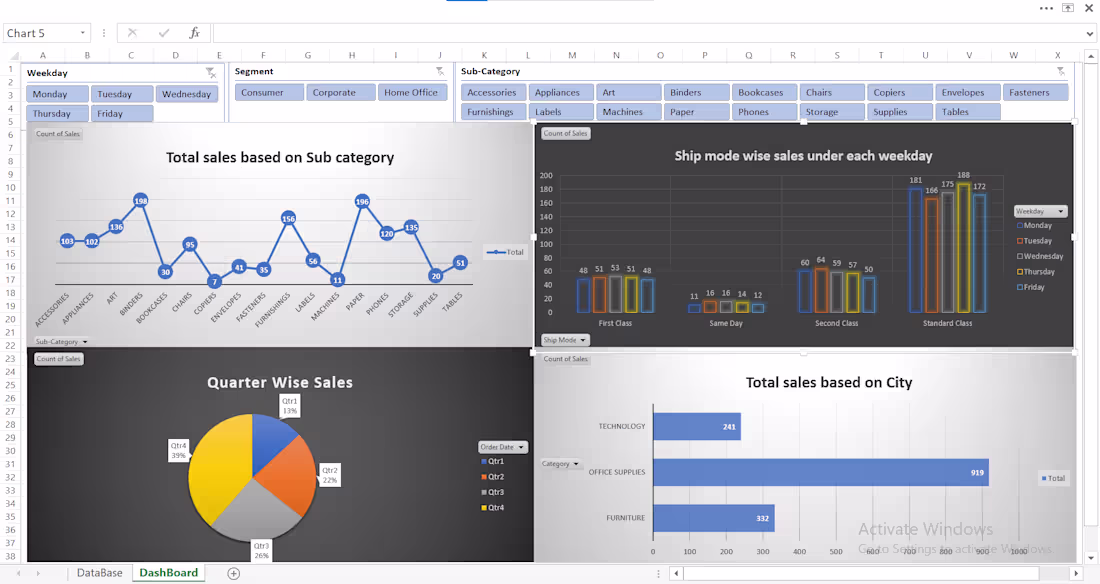
Designed a user-friendly Excel dashboard that transforms raw data into meaningful insights using pivot tables, slicers, dynamic charts, and interactive filters, enabling efficient monitoring of key performance indicators.
1
4
119